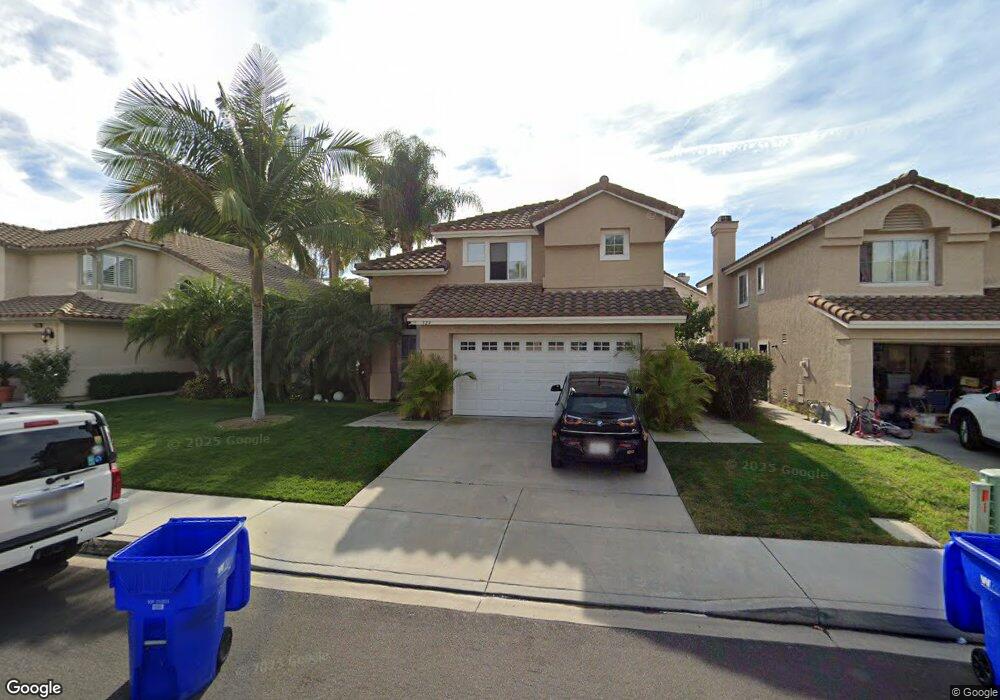
724 Mosaic Cir Oceanside, CA 92057
Ivey Ranch-Rancho Del Oro NeighborhoodEstimated Value: $886,564 - $942,000
3
Beds
3
Baths
1,737
Sq Ft
$528/Sq Ft
Est. Value
About This Home
This home is located at 724 Mosaic Cir, Oceanside, CA 92057 and is currently estimated at $917,641, approximately $528 per square foot. 724 Mosaic Cir is a home located in San Diego County with nearby schools including Alamosa Park Elementary School, Roosevelt Middle School, and Vista High School.
Ownership History
Date
Name
Owned For
Owner Type
Purchase Details
Closed on
Jun 5, 1998
Sold by
Schmitz Jeffery L
Bought by
Schmitz Jeffery L and Schmitz Tiare C
Current Estimated Value
Home Financials for this Owner
Home Financials are based on the most recent Mortgage that was taken out on this home.
Original Mortgage
$170,590
Outstanding Balance
$34,484
Interest Rate
7.17%
Mortgage Type
VA
Estimated Equity
$883,157
Purchase Details
Closed on
Jun 20, 1996
Sold by
Allington John B and Allington Linda S
Bought by
Schmitz Jeffery L
Home Financials for this Owner
Home Financials are based on the most recent Mortgage that was taken out on this home.
Original Mortgage
$163,098
Interest Rate
8.39%
Mortgage Type
VA
Purchase Details
Closed on
Jun 11, 1990
Create a Home Valuation Report for This Property
The Home Valuation Report is an in-depth analysis detailing your home's value as well as a comparison with similar homes in the area
Home Values in the Area
Average Home Value in this Area
Purchase History
| Date | Buyer | Sale Price | Title Company |
|---|---|---|---|
| Schmitz Jeffery L | -- | First American Title | |
| Schmitz Jeffery L | $160,000 | Chicago Title Co | |
| -- | $190,600 | -- |
Source: Public Records
Mortgage History
| Date | Status | Borrower | Loan Amount |
|---|---|---|---|
| Open | Schmitz Jeffery L | $170,590 | |
| Closed | Schmitz Jeffery L | $163,098 |
Source: Public Records
Tax History
| Year | Tax Paid | Tax Assessment Tax Assessment Total Assessment is a certain percentage of the fair market value that is determined by local assessors to be the total taxable value of land and additions on the property. | Land | Improvement |
|---|---|---|---|---|
| 2025 | $2,736 | $260,402 | $77,494 | $182,908 |
| 2024 | $2,736 | $255,297 | $75,975 | $179,322 |
| 2023 | $2,668 | $250,292 | $74,486 | $175,806 |
| 2022 | $2,659 | $245,385 | $73,026 | $172,359 |
| 2021 | $2,605 | $240,575 | $71,595 | $168,980 |
| 2020 | $2,596 | $238,109 | $70,861 | $167,248 |
| 2019 | $2,556 | $233,441 | $69,472 | $163,969 |
| 2018 | $2,435 | $228,864 | $68,110 | $160,754 |
| 2017 | $71 | $224,377 | $66,775 | $157,602 |
| 2016 | $2,331 | $219,978 | $65,466 | $154,512 |
| 2015 | $2,321 | $216,675 | $64,483 | $152,192 |
| 2014 | $2,263 | $212,431 | $63,220 | $149,211 |
Source: Public Records
Map
Nearby Homes
- 761 Masters Dr
- 838 Masters Dr
- 5010 Golondrina Way Unit 64
- 4791 Macadamia Ct
- 872 Oro Grande St
- 4786 Macadamia Ct
- 255 Flame Tree Place
- 245 Smoke Tree Place
- 997 Masters Dr
- 4889 Tarragon Dr
- 1852 Red Willow Way
- 4885 Baroque Terrace
- 185 Harrison St
- 4873 Merida Way
- 4877 Merida Way
- 4867 Merida Way
- 4865 Merida Way
- 4891 Merida Way
- 4885 Merida Way
- 4879 Merida Way
Your Personal Tour Guide
Ask me questions while you tour the home.