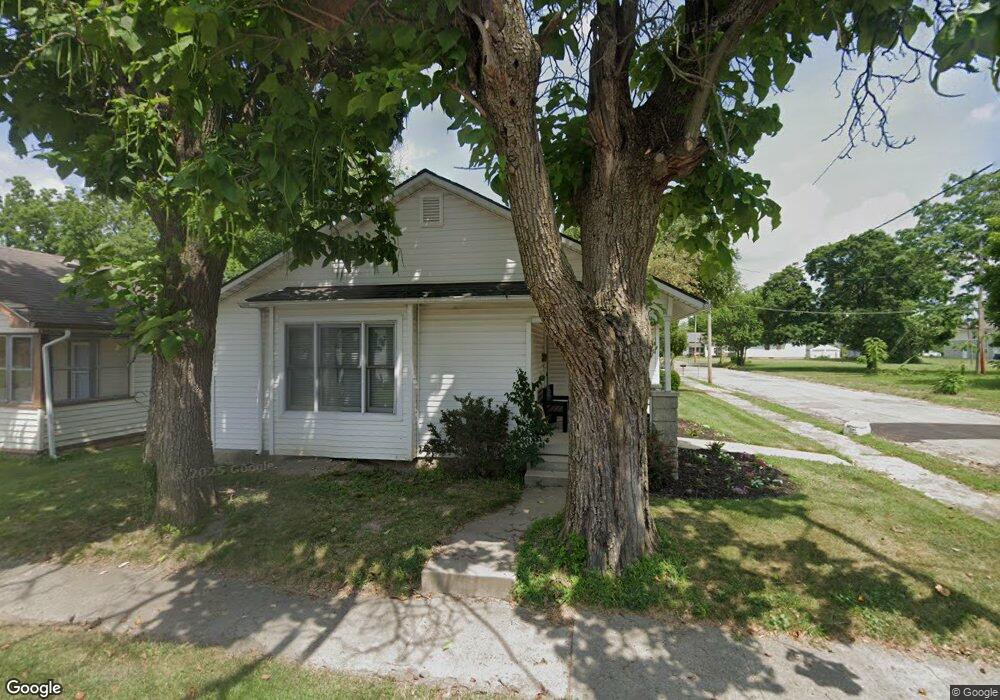
724 S Hackley St Muncie, IN 47302
Industry NeighborhoodEstimated Value: $72,955 - $125,000
Studio
1
Bath
1,172
Sq Ft
$82/Sq Ft
Est. Value
About This Home
This home is located at 724 S Hackley St, Muncie, IN 47302 and is currently estimated at $95,739, approximately $81 per square foot. 724 S Hackley St is a home located in Delaware County with nearby schools including East Washington Academy, Muncie Central High School, and Southside Middle School.
Ownership History
Date
Name
Owned For
Owner Type
Purchase Details
Closed on
Oct 17, 2022
Sold by
Abrams Rentals Llc
Bought by
Abram Michael D
Current Estimated Value
Purchase Details
Closed on
May 20, 2011
Sold by
Abram Sam F and Abram Millie R
Bought by
Abrams Rentals Llc
Purchase Details
Closed on
Aug 16, 2006
Sold by
Citifinancial Services Inc
Bought by
Abram Sam F and Abram Millie R
Home Financials for this Owner
Home Financials are based on the most recent Mortgage that was taken out on this home.
Original Mortgage
$15,300
Interest Rate
6.77%
Mortgage Type
Future Advance Clause Open End Mortgage
Purchase Details
Closed on
May 19, 2006
Sold by
Scott Dorothy L and Scott Harvey
Bought by
Citifinancial Services Inc
Home Financials for this Owner
Home Financials are based on the most recent Mortgage that was taken out on this home.
Original Mortgage
$15,300
Interest Rate
6.77%
Mortgage Type
Future Advance Clause Open End Mortgage
Create a Home Valuation Report for This Property
The Home Valuation Report is an in-depth analysis detailing your home's value as well as a comparison with similar homes in the area
Home Values in the Area
Average Home Value in this Area
Purchase History
We collect this data history from publicly available records. To have your information removed, we recommend requesting removal directly through your county’s website.
| Date | Buyer | Sale Price | Title Company |
|---|---|---|---|
| Abram Michael D | -- | None Listed On Document | |
| Abrams Rentals Llc | -- | None Available | |
| Abram Sam F | -- | None Available | |
| Citifinancial Services Inc | -- | None Available |
Source: Public Records
Mortgage History
We collect this data history from publicly available records. To have your information removed, we recommend requesting removal directly through your county’s website.
| Date | Status | Borrower | Loan Amount |
|---|---|---|---|
| Previous Owner | Abram Sam F | $15,300 | |
| Previous Owner | Citifinancial Services Inc | $15,300 |
Source: Public Records
Tax History
| Year | Tax Paid | Tax Assessment Tax Assessment Total Assessment is a certain percentage of the fair market value that is determined by local assessors to be the total taxable value of land and additions on the property. | Land | Improvement |
|---|---|---|---|---|
| 2025 | $952 | $42,200 | $3,000 | $39,200 |
| 2024 | $1,303 | $30,900 | $3,000 | $27,900 |
| 2023 | $762 | $30,900 | $3,000 | $27,900 |
| 2022 | $732 | $31,200 | $3,000 | $28,200 |
| 2021 | $634 | $26,300 | $1,700 | $24,600 |
| 2020 | $648 | $27,000 | $1,700 | $25,300 |
| 2019 | $648 | $27,000 | $1,700 | $25,300 |
| 2018 | $702 | $27,000 | $1,700 | $25,300 |
| 2017 | $640 | $26,600 | $1,700 | $24,900 |
| 2016 | $639 | $26,600 | $1,700 | $24,900 |
| 2014 | $677 | $31,700 | $1,900 | $29,800 |
| 2013 | -- | $31,800 | $1,900 | $29,900 |
Source: Public Records
Map
Nearby Homes
- 1302 E Kirby Ave
- 1311 E Kirby Ave
- 1311 E 1st St
- 1318 E Kirby Ave
- 1302 S Hackley St
- 1222 E 5th St
- 1402 E Willard St
- 1225 E Adams St
- 633 S Ohio Ave
- 1114 E Jackson St
- 1505 S Vine St
- 825 E Washington St
- 1400 E 7th St
- 1125 E Washington St
- 1215 S Jefferson St
- 1201 S Mulberry St
- 236 N Vine St
- 304 N Hackley St
- 409 N Pershing Dr
- 301 S Walnut St Unit 206
- 722 S Hackley St
- 720 S Hackley St
- 914 E 1st St
- 806 S Hackley St
- 706 S Hackley St
- 725 S Hackley St
- 905 E Kirby Ave Unit 907
- 831 E 1st St
- 909 E 1st St
- 719 S Ebright St
- 829 E 1st St
- 717 S Ebright St
- 915 E Kirby Ave
- 827 E 1st St
- 921 E 1st St
- 814 E 1st St
- 925 E 1st St
- 818 S Hackley St
- 815 S Hackley St
- 812 E 1st St
Your Personal Tour Guide
Ask me questions while you tour the home.