724 Sean Dr Carson City, NV 89701
Al Seeliger NeighborhoodEstimated Value: $447,681 - $627,000
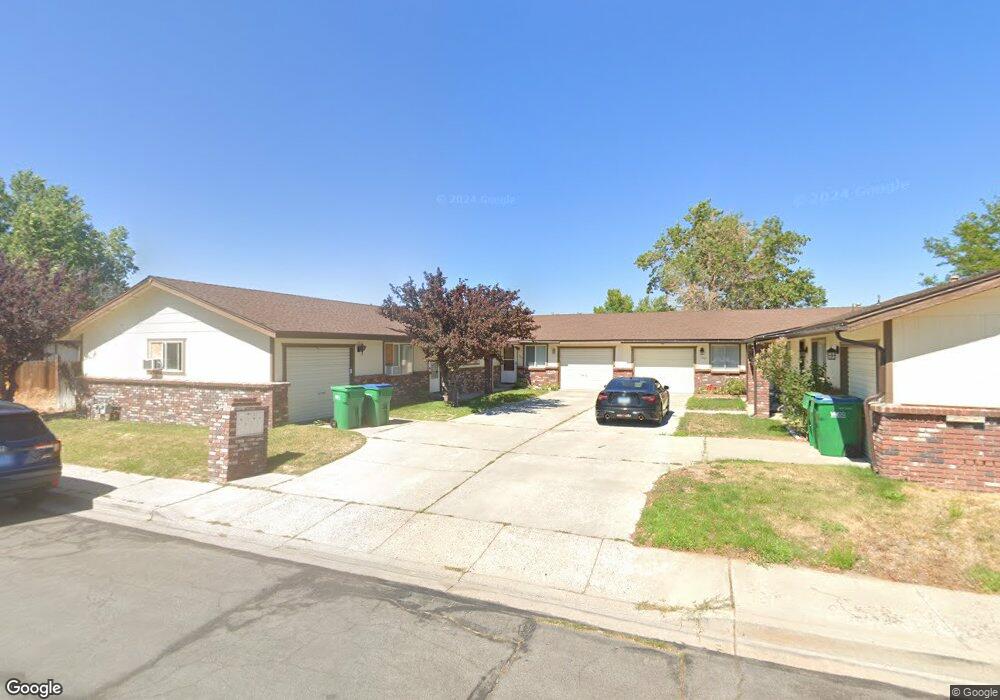
About This Home
This home is located at 724 Sean Dr, Carson City, NV 89701 and is currently estimated at $552,170, approximately $259 per square foot. 724 Sean Dr is a home located in Carson City with nearby schools including Al Seeliger Elementary School, Eagle Valley Middle School, and Carson High School.
Ownership History
We collect this data history from publicly available records. To have your information removed, we recommend requesting removal directly through your county’s website.
Purchase Details
Purchase Details
Purchase Details
Purchase Details
Purchase Details
Home Financials for this Owner
Home Financials are based on the most recent Mortgage that was taken out on this home.Purchase Details
Purchase Details
Home Values in the Area
Average Home Value in this Area
Purchase History
We collect this data history from publicly available records. To have your information removed, we recommend requesting removal directly through your county’s website.
| Date | Buyer | Sale Price | Title Company |
|---|---|---|---|
| -- | None Listed On Document | ||
| $400,000 | First Centennial Reno | ||
| -- | None Available | ||
| -- | None Available | ||
| $44,333 | Western Title Company | ||
| -- | None Available | ||
| -- | None Available |
Mortgage History
We collect this data history from publicly available records. To have your information removed, we recommend requesting removal directly through your county’s website.
| Date | Status | Borrower | Loan Amount |
|---|---|---|---|
| Previous Owner | $74,200 |
Tax History
We collect this data history from publicly available records. To have your information removed, we recommend requesting removal directly through your county’s website.
| Year | Tax Paid | Tax Assessment Tax Assessment Total Assessment is a certain percentage of the fair market value that is determined by local assessors to be the total taxable value of land and additions on the property. | Land | Improvement |
|---|---|---|---|---|
| 2025 | $2,004 | $56,099 | $22,050 | $34,049 |
| 2024 | $2,088 | $58,434 | $22,050 | $36,384 |
| 2023 | $1,950 | $54,582 | $22,050 | $32,532 |
| 2022 | $1,814 | $50,748 | $19,600 | $31,148 |
| 2021 | $1,788 | $50,027 | $18,725 | $31,302 |
| 2019 | $1,808 | $50,625 | $18,725 | $31,900 |
| 2018 | $1,759 | $49,269 | $18,025 | $31,244 |
| 2017 | $1,697 | $48,103 | $16,800 | $31,303 |
| 2016 | $1,655 | $46,991 | $14,700 | $32,291 |
| 2015 | $1,678 | $47,816 | $14,525 | $33,291 |
| 2014 | $1,626 | $46,217 | $14,525 | $31,692 |
Map
- 3015 Chubasco Way
- 718 Travis Dr Unit D
- 718 Travis Dr Unit B
- 3387 Bonnyview Dr
- 621 Colorado St
- 801 Koontz Ln
- 2106 Idaho St
- 170 Koontz Ln Unit 32
- 170 Koontz Ln Unit 157
- 1706 Myles Way
- 2434 Fieldcrest Dr
- 3949 Ponderosa Dr
- 3844 Bonnie Place
- 103 Pilot Peak Dr
- 3869 Bonnie Place
- 3946 Southpointe Dr
- 1110 Bandtail Dr
- 2214 Cognac Ct
- 1529 Valley View Dr
- 2217 Bordeaux St
Ask me questions while you tour the home.