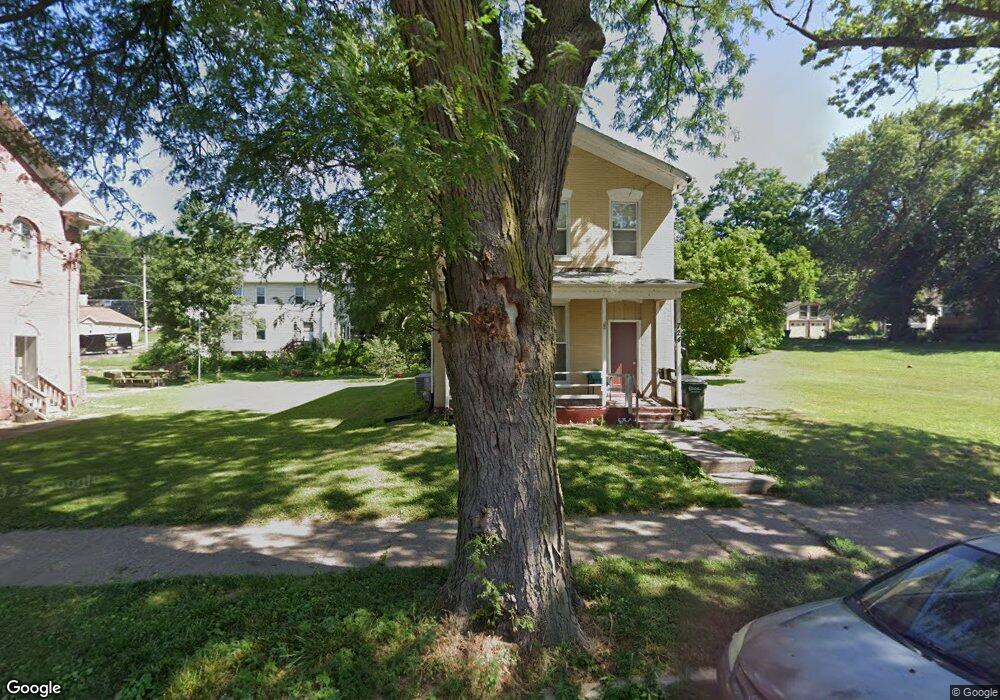
724 W 5th St Davenport, IA 52802
Central Davenport NeighborhoodEstimated Value: $70,000 - $236,402
4
Beds
2
Baths
1,721
Sq Ft
$71/Sq Ft
Est. Value
About This Home
This home is located at 724 W 5th St, Davenport, IA 52802 and is currently estimated at $122,851, approximately $71 per square foot. 724 W 5th St is a home located in Scott County with nearby schools including Walnut Hill Elementary School, Christian County Middle School, and Casey County Middle School.
Ownership History
Date
Name
Owned For
Owner Type
Purchase Details
Closed on
Oct 12, 2016
Sold by
Us Bank National Association
Bought by
Little Fish Llc
Current Estimated Value
Purchase Details
Closed on
Jul 19, 2016
Sold by
Sheriff Of Scott County and Conard Dennis
Bought by
Us Bank National Association
Purchase Details
Closed on
Aug 17, 2012
Sold by
Brown Russell D
Bought by
Brown Alicia L
Home Financials for this Owner
Home Financials are based on the most recent Mortgage that was taken out on this home.
Original Mortgage
$46,148
Interest Rate
3.6%
Mortgage Type
FHA
Create a Home Valuation Report for This Property
The Home Valuation Report is an in-depth analysis detailing your home's value as well as a comparison with similar homes in the area
Home Values in the Area
Average Home Value in this Area
Purchase History
| Date | Buyer | Sale Price | Title Company |
|---|---|---|---|
| Little Fish Llc | $22,500 | None Available | |
| Us Bank National Association | $30,260 | None Available | |
| Brown Alicia L | $47,000 | None Available |
Source: Public Records
Mortgage History
| Date | Status | Borrower | Loan Amount |
|---|---|---|---|
| Previous Owner | Brown Alicia L | $46,148 |
Source: Public Records
Tax History Compared to Growth
Tax History
| Year | Tax Paid | Tax Assessment Tax Assessment Total Assessment is a certain percentage of the fair market value that is determined by local assessors to be the total taxable value of land and additions on the property. | Land | Improvement |
|---|---|---|---|---|
| 2025 | $1,004 | $64,480 | $10,000 | $54,480 |
| 2024 | $980 | $56,180 | $10,000 | $46,180 |
| 2023 | $830 | $56,180 | $10,000 | $46,180 |
| 2022 | $834 | $38,830 | $4,000 | $34,830 |
| 2021 | $834 | $38,830 | $4,000 | $34,830 |
| 2020 | $544 | $34,730 | $4,000 | $30,730 |
| 2019 | $562 | $25,020 | $4,000 | $21,020 |
| 2018 | $682 | $25,020 | $4,000 | $21,020 |
| 2017 | $1,073 | $31,020 | $4,000 | $27,020 |
| 2016 | $1,111 | $0 | $0 | $0 |
| 2015 | $636 | $0 | $0 | $0 |
| 2014 | $654 | $0 | $0 | $0 |
| 2013 | $642 | $0 | $0 | $0 |
| 2012 | -- | $40,700 | $4,760 | $35,940 |
Source: Public Records
Map
Nearby Homes