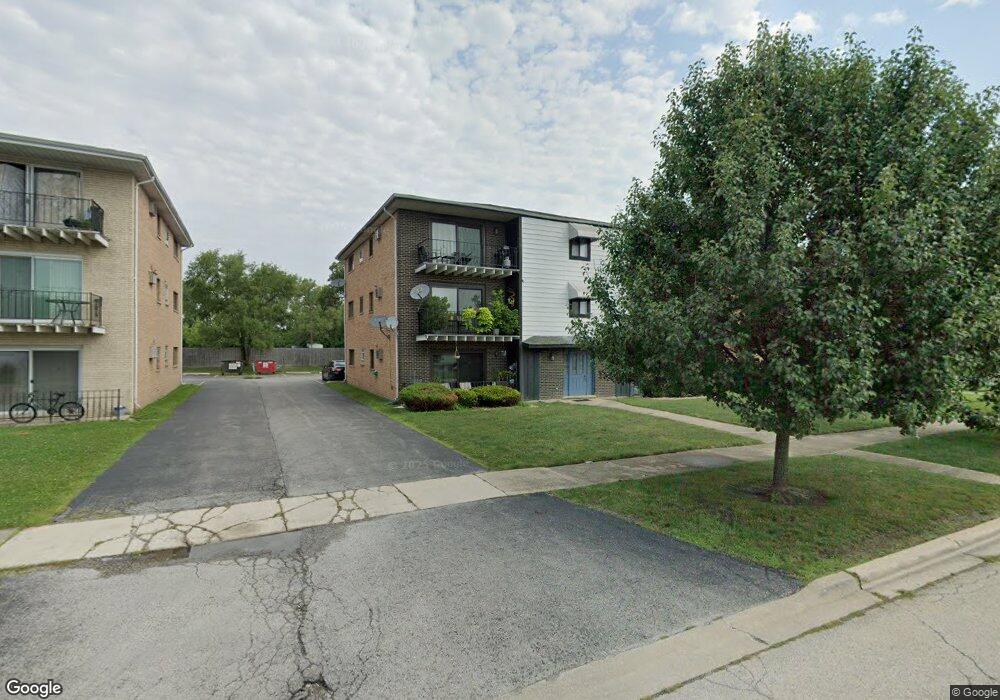
7242 W 86th St Unit 1B Bridgeview, IL 60455
Estimated Value: $155,308 - $186,000
2
Beds
1
Bath
7,300
Sq Ft
$23/Sq Ft
Est. Value
About This Home
This home is located at 7242 W 86th St Unit 1B, Bridgeview, IL 60455 and is currently estimated at $169,077, approximately $23 per square foot. 7242 W 86th St Unit 1B is a home located in Cook County with nearby schools including Bridgeview Elementary School, Argo Community High School, and Aqsa School.
Ownership History
Date
Name
Owned For
Owner Type
Purchase Details
Closed on
Jul 20, 2006
Sold by
Suchecki Grzegorz M
Bought by
Obyrtacz Anna
Current Estimated Value
Home Financials for this Owner
Home Financials are based on the most recent Mortgage that was taken out on this home.
Original Mortgage
$127,500
Outstanding Balance
$77,146
Interest Rate
7%
Mortgage Type
Negative Amortization
Estimated Equity
$91,931
Purchase Details
Closed on
Jul 26, 1999
Sold by
Nash Melissa
Bought by
Suchecki Grzegorz M
Home Financials for this Owner
Home Financials are based on the most recent Mortgage that was taken out on this home.
Original Mortgage
$40,000
Interest Rate
7.69%
Purchase Details
Closed on
Dec 31, 1997
Sold by
Orosz Susan M and Novak Susan M
Bought by
Nash Melissa
Home Financials for this Owner
Home Financials are based on the most recent Mortgage that was taken out on this home.
Original Mortgage
$71,250
Interest Rate
7.26%
Create a Home Valuation Report for This Property
The Home Valuation Report is an in-depth analysis detailing your home's value as well as a comparison with similar homes in the area
Home Values in the Area
Average Home Value in this Area
Purchase History
| Date | Buyer | Sale Price | Title Company |
|---|---|---|---|
| Obyrtacz Anna | $145,500 | Ticor Title | |
| Suchecki Grzegorz M | $73,000 | -- | |
| Nash Melissa | $75,000 | -- |
Source: Public Records
Mortgage History
| Date | Status | Borrower | Loan Amount |
|---|---|---|---|
| Open | Obyrtacz Anna | $127,500 | |
| Previous Owner | Suchecki Grzegorz M | $40,000 | |
| Previous Owner | Nash Melissa | $71,250 |
Source: Public Records
Tax History Compared to Growth
Tax History
| Year | Tax Paid | Tax Assessment Tax Assessment Total Assessment is a certain percentage of the fair market value that is determined by local assessors to be the total taxable value of land and additions on the property. | Land | Improvement |
|---|---|---|---|---|
| 2024 | $3,248 | $12,727 | $822 | $11,905 |
| 2023 | $1,712 | $12,727 | $822 | $11,905 |
| 2022 | $1,712 | $7,704 | $1,965 | $5,739 |
| 2021 | $1,686 | $7,702 | $1,964 | $5,738 |
| 2020 | $1,717 | $7,702 | $1,964 | $5,738 |
| 2019 | $1,606 | $7,326 | $1,781 | $5,545 |
| 2018 | $1,652 | $7,631 | $1,781 | $5,850 |
| 2017 | $1,642 | $7,631 | $1,781 | $5,850 |
| 2016 | $1,967 | $7,300 | $1,553 | $5,747 |
| 2015 | $1,814 | $7,300 | $1,553 | $5,747 |
| 2014 | $1,774 | $7,300 | $1,553 | $5,747 |
| 2013 | $2,369 | $9,577 | $1,553 | $8,024 |
Source: Public Records
Map
Nearby Homes
- 7306 W 86th St Unit 3B
- 7336 W 86th St Unit 2B
- 7345 W 85th Place Unit 3A
- 8800 S Harlem Ave Unit 19
- 8800 S Harlem Ave Unit 2311
- 8800 S Harlem Ave Unit 2111
- 8800 S Harlem Ave
- 7110 W 82nd Place
- 8738 Newland Ave
- 8400 New England Ave
- 8232 S Ferdinand Ave
- 8602 Oak Park Ave
- 8912 Windsor Ln
- 8332 S 77th Ct
- 8356 Oak Park Ave
- 8101 S Oketo Ave
- 7101 Birch St
- 6906 W 91st St
- 6600 W 87th St Unit 3SW
- 7806 W 83rd St
- 7242 W 86th St Unit 2B
- 7242 W 86th St Unit 2A
- 7242 W 86th St Unit 1A
- 7242 W 86th St Unit 3B
- 7242 W 86th St Unit 3A
- 7234 W 86th St Unit 3A
- 7234 W 86th St Unit 1A
- 7234 W 86th St Unit 2A
- 7234 W 86th St Unit 1B
- 7234 W 86th St Unit 3B
- 7234 W 86th St Unit 2B
- 7248 W 86th St Unit 2B
- 7248 W 86th St Unit 2A
- 7248 W 86th St Unit 1A
- 7248 W 86th St Unit 3B
- 7248 W 86th St Unit 3A
- 7248 W 86th St Unit 1B
- 7230 W 86th St Unit 1B
- 7230 W 86th St Unit 3B
- 7230 W 86th St Unit 2A