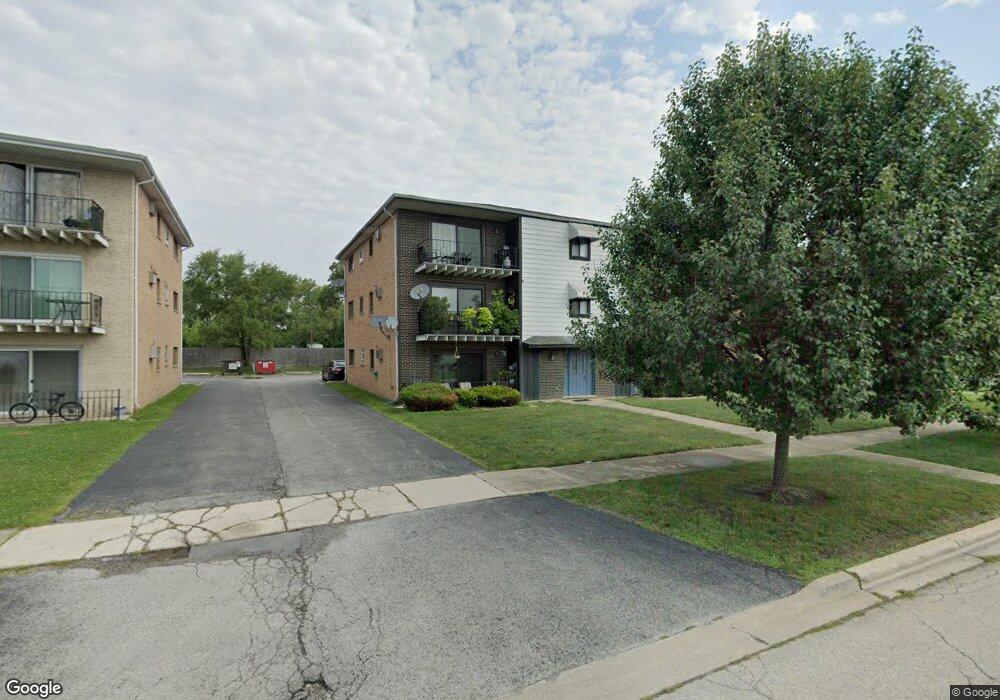
7242 W 86th St Unit 3B Bridgeview, IL 60455
Estimated Value: $170,163 - $180,000
2
Beds
1
Bath
7,300
Sq Ft
$24/Sq Ft
Est. Value
About This Home
This home is located at 7242 W 86th St Unit 3B, Bridgeview, IL 60455 and is currently estimated at $175,291, approximately $24 per square foot. 7242 W 86th St Unit 3B is a home located in Cook County with nearby schools including Bridgeview Elementary School, Argo Community High School, and Aqsa School.
Ownership History
Date
Name
Owned For
Owner Type
Purchase Details
Closed on
Sep 1, 2021
Sold by
Landowski Bogdan R and Landowska Kinga
Bought by
Landowska Maria and Landowska Stanislaw
Current Estimated Value
Purchase Details
Closed on
Aug 26, 2010
Sold by
Zaczek Marian and Zaczek Anna
Bought by
Landowski Bogdan R
Home Financials for this Owner
Home Financials are based on the most recent Mortgage that was taken out on this home.
Original Mortgage
$70,400
Outstanding Balance
$46,134
Interest Rate
4.6%
Mortgage Type
New Conventional
Estimated Equity
$129,157
Purchase Details
Closed on
Jan 14, 2000
Sold by
Old Kent Bank
Bought by
Zaczek Marian and Zaczek Anna
Home Financials for this Owner
Home Financials are based on the most recent Mortgage that was taken out on this home.
Original Mortgage
$28,000
Interest Rate
7.98%
Create a Home Valuation Report for This Property
The Home Valuation Report is an in-depth analysis detailing your home's value as well as a comparison with similar homes in the area
Home Values in the Area
Average Home Value in this Area
Purchase History
| Date | Buyer | Sale Price | Title Company |
|---|---|---|---|
| Landowska Maria | -- | Accommodation | |
| Landowski Bogdan R | $88,000 | None Available | |
| Zaczek Marian | $68,000 | Ticor Title |
Source: Public Records
Mortgage History
| Date | Status | Borrower | Loan Amount |
|---|---|---|---|
| Open | Landowski Bogdan R | $70,400 | |
| Previous Owner | Zaczek Marian | $28,000 |
Source: Public Records
Tax History
| Year | Tax Paid | Tax Assessment Tax Assessment Total Assessment is a certain percentage of the fair market value that is determined by local assessors to be the total taxable value of land and additions on the property. | Land | Improvement |
|---|---|---|---|---|
| 2025 | $3,404 | $13,181 | $852 | $12,329 |
| 2024 | $3,404 | $13,181 | $852 | $12,329 |
| 2023 | $1,821 | $13,181 | $852 | $12,329 |
| 2022 | $1,821 | $7,978 | $2,035 | $5,943 |
| 2021 | $1,791 | $7,976 | $2,034 | $5,942 |
| 2020 | $1,820 | $7,976 | $2,034 | $5,942 |
| 2019 | $1,714 | $7,588 | $1,845 | $5,743 |
| 2018 | $2,309 | $9,299 | $1,845 | $7,454 |
| 2017 | $2,286 | $9,299 | $1,845 | $7,454 |
| 2016 | $2,073 | $7,559 | $1,608 | $5,951 |
| 2015 | $1,914 | $7,559 | $1,608 | $5,951 |
| 2014 | $1,871 | $7,559 | $1,608 | $5,951 |
| 2013 | $2,485 | $9,917 | $1,608 | $8,309 |
Source: Public Records
Map
Nearby Homes
- 7242 W 86th St Unit 3A
- 7329 W 85th Place Unit 2A
- 7234 W 85th St
- 7132 W 84th Place
- 8800 S Harlem Ave Unit 2311
- 8800 S Harlem Ave Unit 2111
- 8800 S Harlem Ave Unit 1127
- 8800 S Harlem Ave Unit 2000A
- 8808 Cranbrook Ln
- 8632 New England Ave
- 7110 W 82nd Place
- 6896 W 87th St Unit 3W
- 8233 S 76th Ave
- 8602 Oak Park Ave
- 8101 S Oketo Ave
- 7700 W 83rd St
- 9112 Homestead Ln
- 8053 Newland Ave
- 8036 Newland Ave
- 8555 S 79th Ave
- 7242 W 86th St Unit 2B
- 7242 W 86th St Unit 1B
- 7242 W 86th St Unit 2A
- 7242 W 86th St Unit 1A
- 7234 W 86th St Unit 3A
- 7234 W 86th St Unit 1A
- 7234 W 86th St Unit 2A
- 7234 W 86th St Unit 1B
- 7234 W 86th St Unit 3B
- 7234 W 86th St Unit 2B
- 7248 W 86th St Unit 2B
- 7248 W 86th St Unit 2A
- 7248 W 86th St Unit 1A
- 7248 W 86th St Unit 3B
- 7248 W 86th St Unit 3A
- 7248 W 86th St Unit 1B
- 7230 W 86th St Unit 1B
- 7230 W 86th St Unit 3B
- 7230 W 86th St Unit 2A
- 7230 W 86th St Unit 3A
Your Personal Tour Guide
Ask me questions while you tour the home.