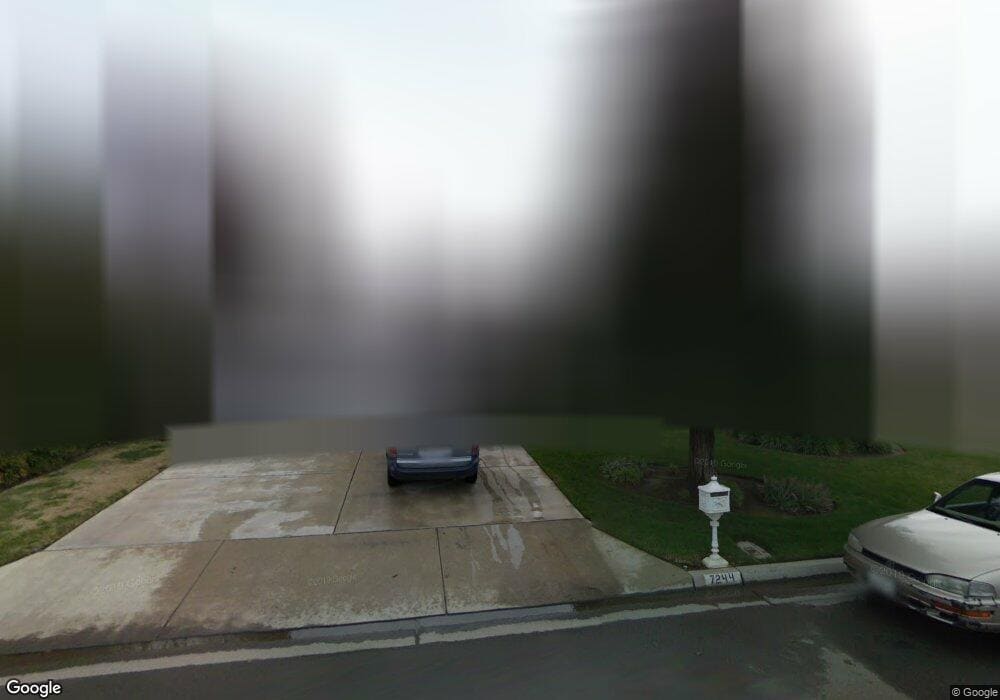
7244 N Babigian Ave Fresno, CA 93722
Sierra Sky Park NeighborhoodEstimated Value: $555,000 - $650,000
4
Beds
3
Baths
2,325
Sq Ft
$254/Sq Ft
Est. Value
About This Home
This home is located at 7244 N Babigian Ave, Fresno, CA 93722 and is currently estimated at $590,478, approximately $253 per square foot. 7244 N Babigian Ave is a home located in Fresno County with nearby schools including Norman Liddell Elementary and Rio Vista Middle School.
Ownership History
Date
Name
Owned For
Owner Type
Purchase Details
Closed on
Jul 27, 2023
Sold by
Noyes Eliz
Current Estimated Value
Home Financials for this Owner
Home Financials are based on the most recent Mortgage that was taken out on this home.
Original Mortgage
$491,790
Outstanding Balance
$480,289
Interest Rate
6.67%
Mortgage Type
New Conventional
Estimated Equity
$110,189
Purchase Details
Closed on
Feb 23, 1995
Sold by
Rio Ventana Ltd Partnership
Bought by
N T Hill Inc
Purchase Details
Closed on
Feb 1, 1995
Sold by
N T Hill Inc
Bought by
Noyes Eliz
Home Financials for this Owner
Home Financials are based on the most recent Mortgage that was taken out on this home.
Original Mortgage
$144,492
Interest Rate
9.21%
Purchase Details
Closed on
Dec 20, 1994
Sold by
Noyes William C
Bought by
Noyes Eliz
Home Financials for this Owner
Home Financials are based on the most recent Mortgage that was taken out on this home.
Original Mortgage
$144,492
Interest Rate
9.21%
Create a Home Valuation Report for This Property
The Home Valuation Report is an in-depth analysis detailing your home's value as well as a comparison with similar homes in the area
Home Values in the Area
Average Home Value in this Area
Purchase History
| Date | Buyer | Sale Price | Title Company |
|---|---|---|---|
| -- | $507,000 | Chicago Title | |
| N T Hill Inc | -- | Chicago Title Company | |
| Noyes Eliz | $181,000 | Central Title Company | |
| Noyes Eliz | -- | Central Title Company |
Source: Public Records
Mortgage History
| Date | Status | Borrower | Loan Amount |
|---|---|---|---|
| Open | -- | $491,790 | |
| Previous Owner | Noyes Eliz | $144,492 |
Source: Public Records
Tax History Compared to Growth
Tax History
| Year | Tax Paid | Tax Assessment Tax Assessment Total Assessment is a certain percentage of the fair market value that is determined by local assessors to be the total taxable value of land and additions on the property. | Land | Improvement |
|---|---|---|---|---|
| 2025 | $6,596 | $517,140 | $155,142 | $361,998 |
| 2023 | $6,596 | $303,008 | $77,479 | $225,529 |
| 2022 | $3,759 | $297,067 | $75,960 | $221,107 |
| 2021 | $3,787 | $291,243 | $74,471 | $216,772 |
| 2020 | $3,605 | $288,258 | $73,708 | $214,550 |
| 2019 | $3,552 | $282,607 | $72,263 | $210,344 |
| 2018 | $3,472 | $277,067 | $70,847 | $206,220 |
| 2017 | $3,485 | $271,635 | $69,458 | $202,177 |
| 2016 | $3,218 | $266,310 | $68,097 | $198,213 |
| 2015 | $3,205 | $262,311 | $67,075 | $195,236 |
| 2014 | $3,206 | $257,174 | $65,762 | $191,412 |
Source: Public Records
Map
Nearby Homes
- 4650 W Chennault Ave
- 4968 W Pinedale Ave
- 4918 W Bluff Ave
- 5094 W Cromwell Ave
- 4222 W Alluvial Ave
- 7752 N Gilroy Ave
- 4386 W Magill Ave
- 6542 N Brix Ave
- 6508 N Lodi Ave
- 5191 W Wathen Ave
- 5313 W King Fisher Ln
- 6583 N State Ave
- 7285 N San Pedro Ave
- 4229 W Palo Alto Ave
- 6484 N Pima Ave
- 5567 W Magill Ave
- 6430 N Pima Ave
- 6413 N Pima Ave
- 6296 N Lodi Ave
- 6675 N Lola Ave
- 4736 W Birch Ave
- 7256 N Babigian Ave
- 7239 N Katy Ave
- 7251 N Katy Ave
- 7268 N Babigian Ave
- 7237 N Babigian Ave
- 4753 W Birch Ave
- 7249 N Babigian Ave
- 4765 W Birch Ave
- 7263 N Katy Ave
- 4743 W Birch Ave
- 7225 N Babigian Ave
- 7261 N Babigian Ave
- 7280 N Babigian Ave
- 7275 N Katy Ave
- 7248 N Katy Ave
- 7236 N Katy Ave
- 7260 N Katy Ave
- 7292 N Babigian Ave
- 4715 W Birch Ave