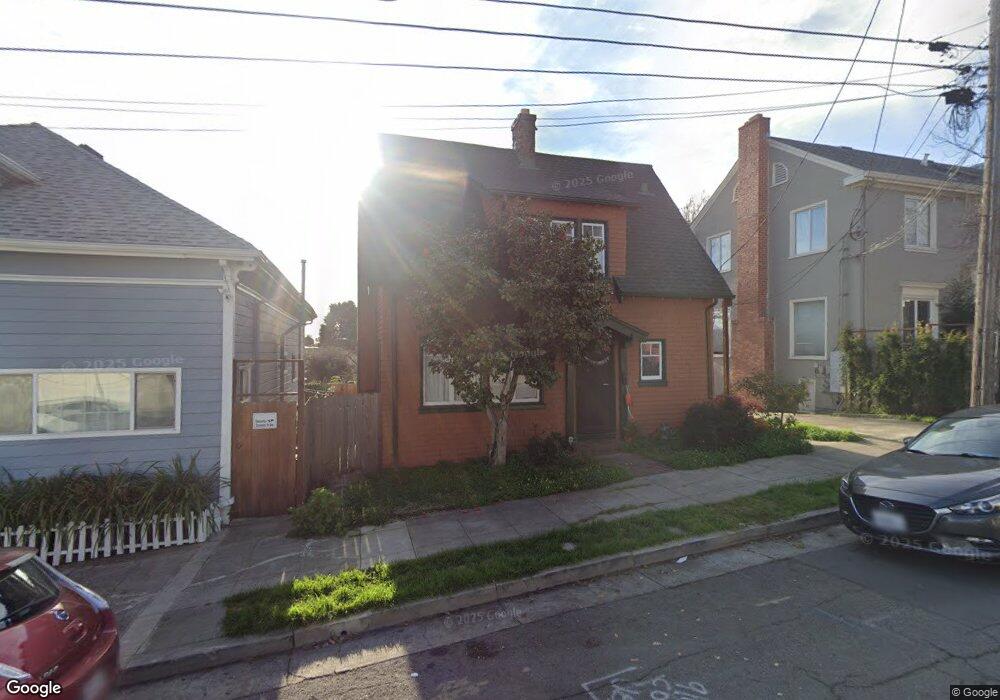
725 E 23rd St Oakland, CA 94606
Ivy Hill NeighborhoodEstimated Value: $550,924 - $774,000
2
Beds
1
Bath
1,148
Sq Ft
$573/Sq Ft
Est. Value
About This Home
This home is located at 725 E 23rd St, Oakland, CA 94606 and is currently estimated at $657,481, approximately $572 per square foot. 725 E 23rd St is a home located in Alameda County with nearby schools including Bella Vista Elementary School, Edna Brewer Middle School, and Oakland High School.
Ownership History
Date
Name
Owned For
Owner Type
Purchase Details
Closed on
Nov 22, 2013
Sold by
Lee Sun Hee and Lee Lynette Jung
Bought by
Lee Sun Hee and Lee Lynette Jung
Current Estimated Value
Purchase Details
Closed on
Aug 29, 2005
Sold by
Lee Lynette J and Lee Sun H
Bought by
Lee Sun H and Lee Lynette J
Home Financials for this Owner
Home Financials are based on the most recent Mortgage that was taken out on this home.
Original Mortgage
$155,000
Interest Rate
5.64%
Mortgage Type
New Conventional
Create a Home Valuation Report for This Property
The Home Valuation Report is an in-depth analysis detailing your home's value as well as a comparison with similar homes in the area
Home Values in the Area
Average Home Value in this Area
Purchase History
| Date | Buyer | Sale Price | Title Company |
|---|---|---|---|
| Lee Sun Hee | -- | None Available | |
| Lee Sun H | -- | Financial Title Company |
Source: Public Records
Mortgage History
| Date | Status | Borrower | Loan Amount |
|---|---|---|---|
| Closed | Lee Sun H | $155,000 |
Source: Public Records
Tax History
| Year | Tax Paid | Tax Assessment Tax Assessment Total Assessment is a certain percentage of the fair market value that is determined by local assessors to be the total taxable value of land and additions on the property. | Land | Improvement |
|---|---|---|---|---|
| 2025 | $2,574 | $58,678 | $39,590 | $19,088 |
| 2024 | $2,574 | $57,527 | $38,814 | $18,713 |
| 2023 | $2,572 | $56,399 | $38,053 | $18,346 |
| 2022 | $2,429 | $55,293 | $37,306 | $17,987 |
| 2021 | $2,161 | $54,209 | $36,575 | $17,634 |
| 2020 | $2,135 | $53,653 | $36,200 | $17,453 |
| 2019 | $1,953 | $52,601 | $35,490 | $17,111 |
| 2018 | $1,917 | $51,570 | $34,794 | $16,776 |
| 2017 | $1,806 | $50,559 | $34,112 | $16,447 |
| 2016 | $1,650 | $49,567 | $33,443 | $16,124 |
| 2015 | $1,637 | $48,823 | $32,941 | $15,882 |
| 2014 | $1,534 | $47,867 | $32,296 | $15,571 |
Source: Public Records
Map
Nearby Homes
- 726 E 23rd St
- 2306 Ivy Dr
- 2420 9th Ave
- 2445 10th Ave
- 807 Brooklyn Ave
- 2605 9th Ave
- 812 E 19th St
- 501 E 20th St
- 326 Athol Ave
- 2301 12th Ave
- 1140 E 22nd St
- 1206 E 22nd St
- 402 Newton Ave
- 2737 12th Ave
- 842 E 17th St
- 650 Hillsborough St
- 2711 13th Ave
- 335 Hanover Ave
- 322 Hanover Ave Unit 409
- 322 Hanover Ave Unit 107
Your Personal Tour Guide
Ask me questions while you tour the home.