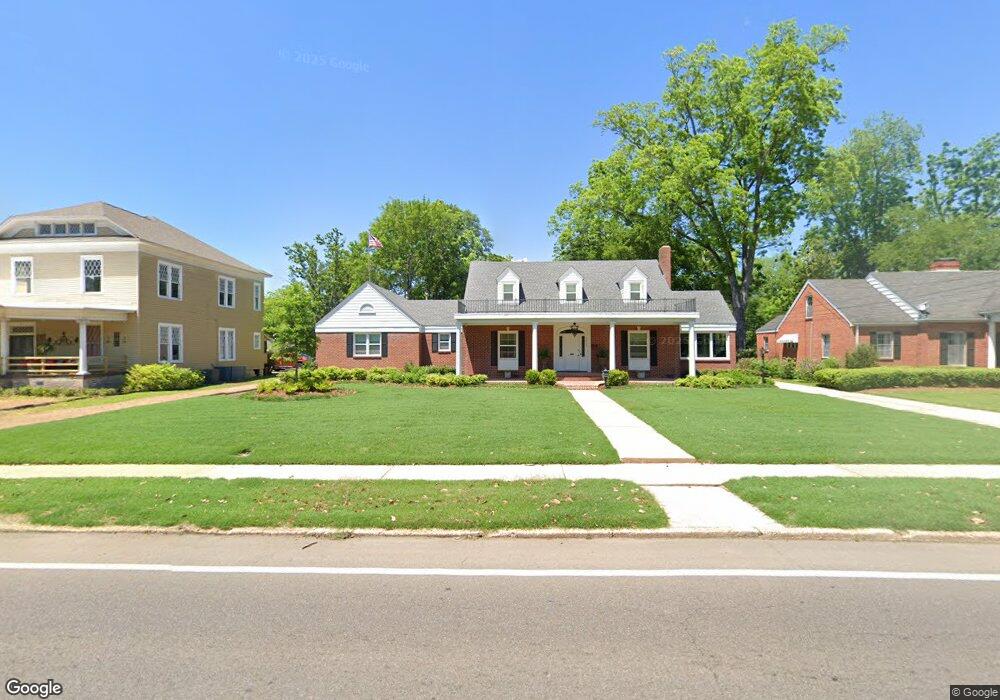
725 E Main St West Point, MS 39773
Estimated Value: $202,000 - $367,000
3
Beds
--
Bath
3,799
Sq Ft
$79/Sq Ft
Est. Value
About This Home
This home is located at 725 E Main St, West Point, MS 39773 and is currently estimated at $299,559, approximately $78 per square foot. 725 E Main St is a home located in Clay County with nearby schools including East Side Elementary School, West Clay Elementary School, and Church Hill Elementary School.
Ownership History
Date
Name
Owned For
Owner Type
Purchase Details
Closed on
Jun 27, 2005
Sold by
White Timothy R and White Teresa M
Bought by
Falkner Murry C and Falkner Sharon
Current Estimated Value
Home Financials for this Owner
Home Financials are based on the most recent Mortgage that was taken out on this home.
Original Mortgage
$60,000
Interest Rate
5.57%
Create a Home Valuation Report for This Property
The Home Valuation Report is an in-depth analysis detailing your home's value as well as a comparison with similar homes in the area
Purchase History
| Date | Buyer | Sale Price | Title Company |
|---|---|---|---|
| Falkner Murry C | -- | -- |
Source: Public Records
Mortgage History
| Date | Status | Borrower | Loan Amount |
|---|---|---|---|
| Closed | Falkner Murry C | $60,000 | |
| Previous Owner | Falkner Murry C | $163,922 |
Source: Public Records
Tax History
| Year | Tax Paid | Tax Assessment Tax Assessment Total Assessment is a certain percentage of the fair market value that is determined by local assessors to be the total taxable value of land and additions on the property. | Land | Improvement |
|---|---|---|---|---|
| 2025 | $1,103 | $23,097 | $3,390 | $19,707 |
| 2024 | $1,103 | $23,097 | $3,390 | $19,707 |
| 2023 | $2,601 | $19,385 | $3,390 | $15,995 |
| 2022 | $931 | $19,385 | $3,390 | $15,995 |
| 2021 | $918 | $19,385 | $3,390 | $15,995 |
| 2020 | $923 | $19,385 | $3,390 | $15,995 |
| 2019 | $842 | $19,242 | $3,390 | $15,852 |
| 2018 | $811 | $19,242 | $3,390 | $15,852 |
| 2017 | $802 | $19,242 | $3,390 | $15,852 |
| 2016 | $794 | $19,242 | $3,390 | $15,852 |
| 2015 | $786 | $18,635 | $3,390 | $15,245 |
| 2014 | $614 | $18,635 | $3,390 | $15,245 |
| 2013 | $614 | $18,635 | $3,390 | $15,245 |
Source: Public Records
Map
Nearby Homes
- 26788 E Main St
- 26852 E Main St
- 26596 E Main St
- 27045 E Main St
- 123 Cottrell St
- 530 E Morrow St
- 551 E Westbrook St
- 184 Tournament St
- 238 Calhoun St
- 761 E Morrow St
- 341 Mccord St
- 33 Court
- 228 S Division St
- 913 E Westbrook St
- 229 S Division St
- 228 Mccord St
- 13 Cul de Sac St
- 159 Washington St
- 218 Lewellen St
- 507 S Eshman Ave
Your Personal Tour Guide
Ask me questions while you tour the home.