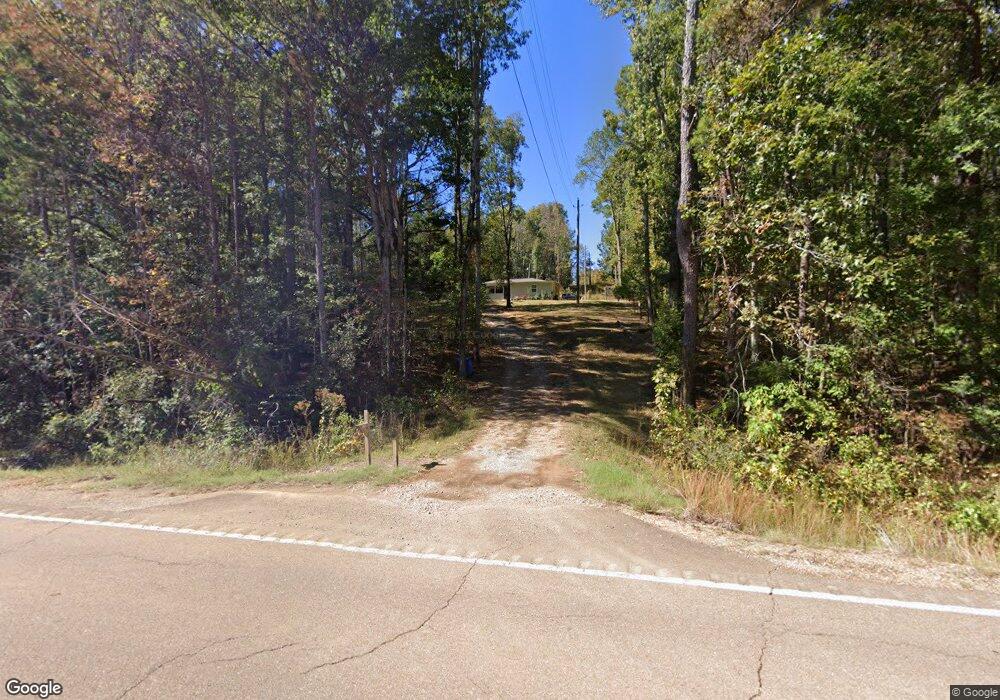
725 Highway 9 W Banner, MS 38913
Estimated Value: $89,544 - $355,000
3
Beds
--
Bath
1,369
Sq Ft
$136/Sq Ft
Est. Value
About This Home
This home is located at 725 Highway 9 W, Banner, MS 38913 and is currently estimated at $186,636, approximately $136 per square foot. 725 Highway 9 W is a home with nearby schools including Bruce Elementary School, Bruce Upper Elementary School, and Bruce High School.
Ownership History
Date
Name
Owned For
Owner Type
Purchase Details
Closed on
Aug 4, 2006
Sold by
Watkins Scott
Bought by
Gallagher Paul R
Current Estimated Value
Create a Home Valuation Report for This Property
The Home Valuation Report is an in-depth analysis detailing your home's value as well as a comparison with similar homes in the area
Home Values in the Area
Average Home Value in this Area
Purchase History
| Date | Buyer | Sale Price | Title Company |
|---|---|---|---|
| Gallagher Paul R | -- | -- |
Source: Public Records
Tax History Compared to Growth
Tax History
| Year | Tax Paid | Tax Assessment Tax Assessment Total Assessment is a certain percentage of the fair market value that is determined by local assessors to be the total taxable value of land and additions on the property. | Land | Improvement |
|---|---|---|---|---|
| 2024 | $452 | $5,255 | $525 | $4,730 |
| 2023 | $410 | $5,255 | $525 | $4,730 |
| 2022 | $356 | $4,350 | $525 | $3,825 |
| 2021 | $335 | $4,350 | $525 | $3,825 |
| 2020 | $329 | $4,350 | $525 | $3,825 |
| 2019 | $321 | $4,350 | $525 | $3,825 |
| 2018 | $309 | $4,281 | $525 | $3,756 |
| 2017 | $310 | $4,281 | $525 | $3,756 |
| 2016 | $310 | $4,281 | $525 | $3,756 |
| 2015 | $306 | $4,281 | $525 | $3,756 |
| 2014 | -- | $4,473 | $525 | $3,948 |
| 2013 | -- | $4,473 | $525 | $3,948 |
Source: Public Records
Map
Nearby Homes
- 0 Hwy 9
- 0 County Road 235
- 179 Mississippi 331
- 0 Cr 331
- 217 281
- 0 Cr 331
- TBD Cr 428
- 1 Cr 272
- 861 Mississippi 331
- 0 County Road 233
- Tbd Cr 235
- 0 County Road 428
- 00 County Road 428
- 717 Cr 235
- 16 County Road 493
- 0 County Road 481
- 512 County Road 445
- 514 County Road 445
- 734 County Road 445
- 87 Mississippi 9w