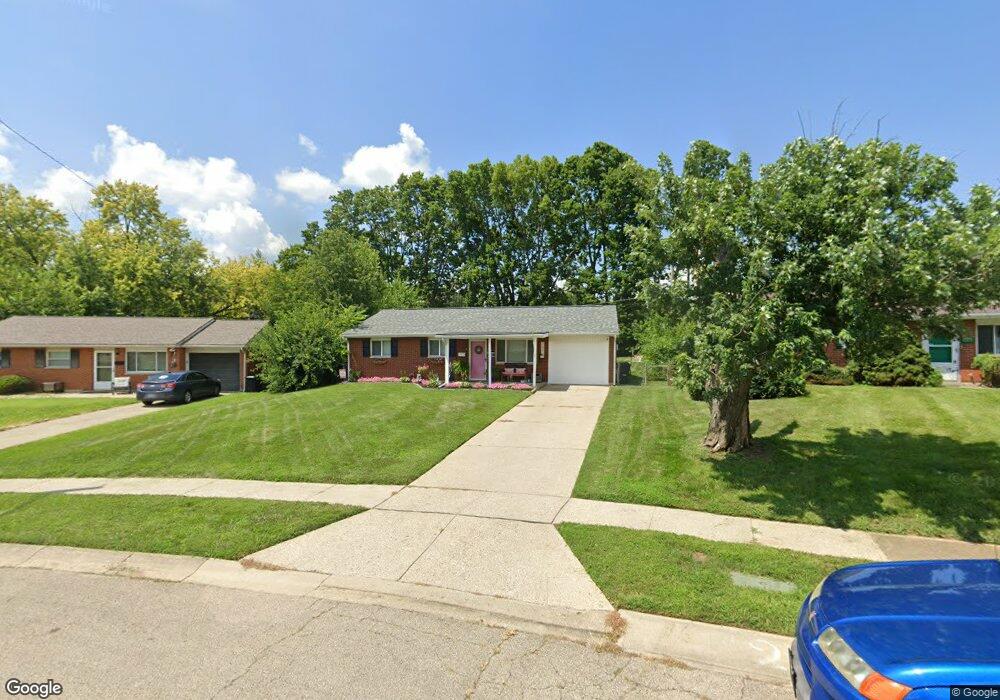
725 Loop St Miamisburg, OH 45342
Downtown Miamisburg NeighborhoodEstimated Value: $170,781 - $192,000
3
Beds
2
Baths
1,015
Sq Ft
$177/Sq Ft
Est. Value
About This Home
This home is located at 725 Loop St, Miamisburg, OH 45342 and is currently estimated at $179,695, approximately $177 per square foot. 725 Loop St is a home located in Montgomery County with nearby schools including Miamisburg High School and Bethel Baptist School.
Ownership History
Date
Name
Owned For
Owner Type
Purchase Details
Closed on
Jul 15, 2022
Sold by
Lovelace Jon A and Lovelace Jackie L
Bought by
Jones Shawn M and Engle Tiffany R
Current Estimated Value
Home Financials for this Owner
Home Financials are based on the most recent Mortgage that was taken out on this home.
Original Mortgage
$127,153
Outstanding Balance
$121,185
Interest Rate
5.78%
Mortgage Type
New Conventional
Estimated Equity
$58,510
Purchase Details
Closed on
Apr 17, 1998
Sold by
Mcquinn James W and Mcquinn Belvie J
Bought by
Lovelace Jon A and Lovelace Jackie L
Home Financials for this Owner
Home Financials are based on the most recent Mortgage that was taken out on this home.
Original Mortgage
$83,670
Interest Rate
7.27%
Mortgage Type
FHA
Purchase Details
Closed on
Jan 31, 1998
Sold by
Davis Eunice
Bought by
Mcquinn James W and Mcquinn Belvie J
Create a Home Valuation Report for This Property
The Home Valuation Report is an in-depth analysis detailing your home's value as well as a comparison with similar homes in the area
Home Values in the Area
Average Home Value in this Area
Purchase History
| Date | Buyer | Sale Price | Title Company |
|---|---|---|---|
| Jones Shawn M | $129,500 | None Listed On Document | |
| Lovelace Jon A | $83,900 | -- | |
| Lovelace Jon A | $83,900 | -- | |
| Mcquinn James W | $73,000 | -- | |
| Mcquinn James W | $73,000 | -- |
Source: Public Records
Mortgage History
| Date | Status | Borrower | Loan Amount |
|---|---|---|---|
| Open | Jones Shawn M | $127,153 | |
| Previous Owner | Lovelace Jon A | $83,670 |
Source: Public Records
Tax History
| Year | Tax Paid | Tax Assessment Tax Assessment Total Assessment is a certain percentage of the fair market value that is determined by local assessors to be the total taxable value of land and additions on the property. | Land | Improvement |
|---|---|---|---|---|
| 2025 | $3,383 | $51,870 | $10,430 | $41,440 |
| 2024 | $3,298 | $51,870 | $10,430 | $41,440 |
| 2023 | $3,298 | $51,870 | $10,430 | $41,440 |
| 2022 | $2,630 | $34,810 | $7,000 | $27,810 |
| 2021 | $2,327 | $34,810 | $7,000 | $27,810 |
| 2020 | $2,322 | $34,810 | $7,000 | $27,810 |
| 2019 | $2,162 | $29,720 | $7,000 | $22,720 |
| 2018 | $2,169 | $29,720 | $7,000 | $22,720 |
| 2017 | $2,154 | $29,720 | $7,000 | $22,720 |
| 2016 | $1,910 | $25,370 | $7,000 | $18,370 |
| 2015 | $1,873 | $25,370 | $7,000 | $18,370 |
| 2014 | $1,873 | $25,370 | $7,000 | $18,370 |
| 2012 | -- | $32,860 | $9,800 | $23,060 |
Source: Public Records
Map
Nearby Homes
- 1103 Kercher St
- 1205 Kercher St
- 1020 N 11th St
- 1306 Kercher St
- 638 Sennett St
- 1102 N Heincke Rd
- 545 Buckeye St
- 542 E Pearl St
- 740 E Central Ave
- 1410 Orchard Hill Dr
- 736 Park Ave
- 304 N 4th St
- 722 Little John Ct
- 326 N 1st St
- 1660 E Central Ave
- 1740 E Lindsey Ave
- 319 N 1st St
- 312 Applehill Dr
- 1845 S Bayberry Dr
- 402 Wilson Park Dr
Your Personal Tour Guide
Ask me questions while you tour the home.