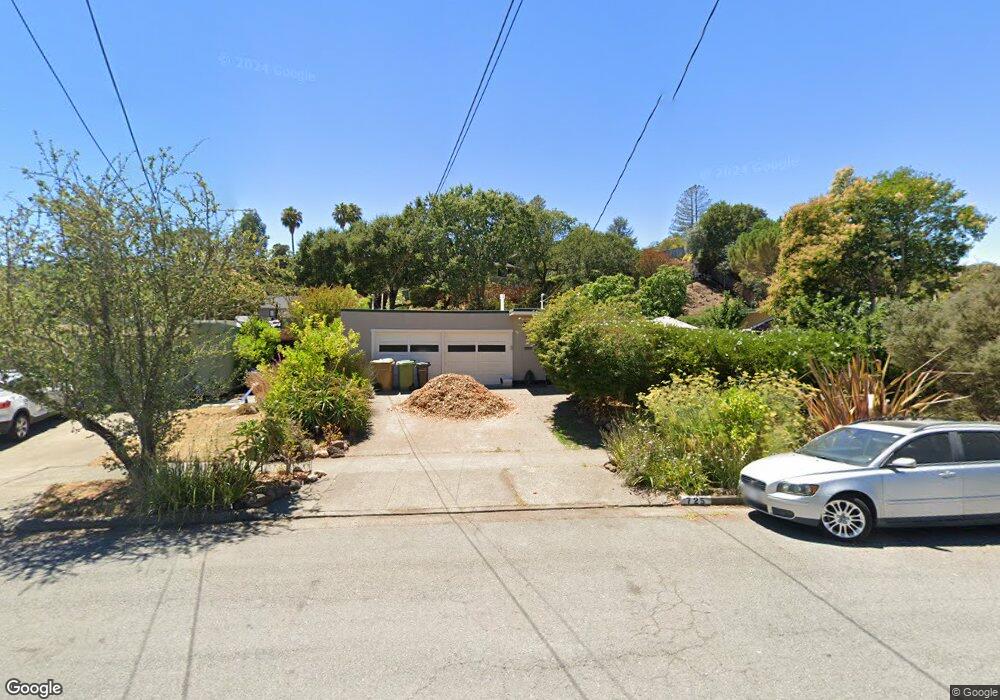
725 Montecillo Rd San Rafael, CA 94903
Terra Linda NeighborhoodEstimated Value: $1,248,000 - $1,410,000
3
Beds
2
Baths
1,512
Sq Ft
$881/Sq Ft
Est. Value
About This Home
This home is located at 725 Montecillo Rd, San Rafael, CA 94903 and is currently estimated at $1,332,530, approximately $881 per square foot. 725 Montecillo Rd is a home located in Marin County with nearby schools including Vallecito Elementary School, Miller Creek Middle School, and Terra Linda High School.
Ownership History
Date
Name
Owned For
Owner Type
Purchase Details
Closed on
Jan 14, 2026
Sold by
Glass Richard A
Bought by
Glass Richard A
Current Estimated Value
Home Financials for this Owner
Home Financials are based on the most recent Mortgage that was taken out on this home.
Original Mortgage
$200,000
Outstanding Balance
$199,809
Interest Rate
6.22%
Mortgage Type
Credit Line Revolving
Estimated Equity
$1,132,721
Purchase Details
Closed on
Oct 14, 2014
Sold by
Glass Glenda Droguett
Bought by
Glass Richard A
Home Financials for this Owner
Home Financials are based on the most recent Mortgage that was taken out on this home.
Original Mortgage
$50,000
Interest Rate
4.17%
Mortgage Type
Future Advance Clause Open End Mortgage
Purchase Details
Closed on
Sep 24, 2009
Sold by
King Eric K and King Patricia B
Bought by
Glass Richard A
Home Financials for this Owner
Home Financials are based on the most recent Mortgage that was taken out on this home.
Original Mortgage
$683,393
Interest Rate
5.08%
Mortgage Type
FHA
Purchase Details
Closed on
Jun 30, 1994
Sold by
Mitchell Martin H
Bought by
King Eric N and King Patricia B
Home Financials for this Owner
Home Financials are based on the most recent Mortgage that was taken out on this home.
Original Mortgage
$229,500
Interest Rate
8.53%
Create a Home Valuation Report for This Property
The Home Valuation Report is an in-depth analysis detailing your home's value as well as a comparison with similar homes in the area
Home Values in the Area
Average Home Value in this Area
Purchase History
| Date | Buyer | Sale Price | Title Company |
|---|---|---|---|
| Glass Richard A | -- | First American Title | |
| Glass Richard A | -- | Fidelity National Title Co | |
| Glass Richard A | $696,000 | Fidelity National Title Co | |
| King Eric N | $255,000 | -- |
Source: Public Records
Mortgage History
| Date | Status | Borrower | Loan Amount |
|---|---|---|---|
| Open | Glass Richard A | $200,000 | |
| Previous Owner | Glass Richard A | $50,000 | |
| Previous Owner | Glass Richard A | $625,500 | |
| Previous Owner | Glass Richard A | $683,393 | |
| Previous Owner | King Eric N | $229,500 |
Source: Public Records
Tax History
| Year | Tax Paid | Tax Assessment Tax Assessment Total Assessment is a certain percentage of the fair market value that is determined by local assessors to be the total taxable value of land and additions on the property. | Land | Improvement |
|---|---|---|---|---|
| 2025 | $13,239 | $898,347 | $580,828 | $317,519 |
| 2024 | $12,622 | $880,738 | $569,443 | $311,295 |
| 2023 | $12,577 | $863,471 | $558,279 | $305,192 |
| 2022 | $12,062 | $846,544 | $547,335 | $299,209 |
| 2021 | $11,502 | $829,952 | $536,607 | $293,345 |
| 2020 | $11,473 | $821,447 | $531,108 | $290,339 |
| 2019 | $11,071 | $805,341 | $520,695 | $284,646 |
| 2018 | $10,932 | $789,556 | $510,489 | $279,067 |
| 2017 | $10,299 | $774,077 | $500,481 | $273,596 |
| 2016 | $10,071 | $758,904 | $490,671 | $268,233 |
| 2015 | $9,808 | $747,510 | $483,304 | $264,206 |
| 2014 | $9,168 | $732,874 | $473,841 | $259,033 |
Source: Public Records
Map
Nearby Homes
- 750 Montecillo Rd
- 19 Surrey Ln
- 46 Surrey Ln
- 81 Forest Ln
- 876 Las Ovejas Ave
- 96 Forest Ln
- 94 Forest Ln
- 952 Lea Dr Unit 30
- 211 Danielle Dr
- 405 Sylvia Way
- 587 Tanbark Terrace
- 659 Las Colindas Rd
- 829 Del Ganado Rd
- 33 Fawn Dr
- 1881 Las Gallinas Ave
- 11 Oak Tree Ct
- 892 Greenberry Ln
- 100 Thorndale Dr Unit 450
- 100 Thorndale Dr Unit 125
- 100 Thorndale Dr Unit 327
- 731 Montecillo Rd
- 721 Montecillo Rd
- 732 Birchwood Ct
- 737 Montecillo Rd
- 717 Montecillo Rd
- 724 Birchwood Ct
- 716 Montecillo Rd
- 720 Montecillo Rd
- 745 Montecillo Rd
- 716 Birchwood Ct
- 728 Montecillo Rd
- 740 Birchwood Ct
- 710 Montecillo Rd
- 732 Montecillo Rd
- 749 Montecillo Rd
- 705 Montecillo Rd
- 736 Montecillo Rd
- 704 Montecillo Rd
- 685 Barberry Ln
- 735 Birchwood Ct
Your Personal Tour Guide
Ask me questions while you tour the home.