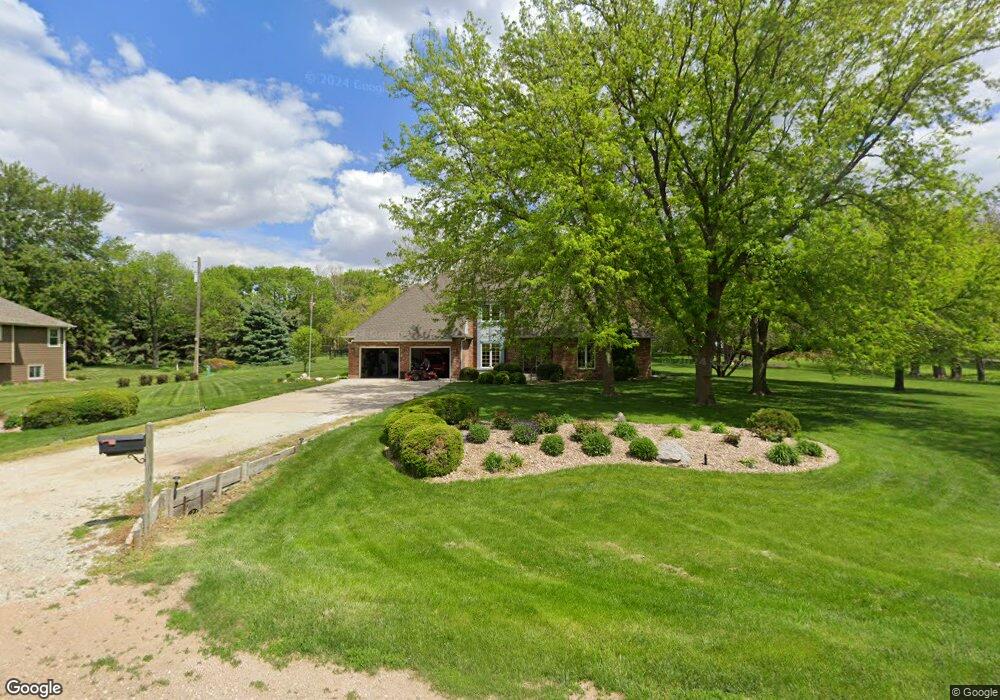
725 N 10th St Geneva, NE 68361
Estimated Value: $349,000 - $406,420
3
Beds
3
Baths
2,918
Sq Ft
$131/Sq Ft
Est. Value
About This Home
This home is located at 725 N 10th St, Geneva, NE 68361 and is currently estimated at $382,105, approximately $130 per square foot. 725 N 10th St is a home located in Fillmore County with nearby schools including Fillmore Central Elementary School, Fillmore Central Middle School, and Fillmore Central High School.
Ownership History
Date
Name
Owned For
Owner Type
Purchase Details
Closed on
Dec 5, 2024
Sold by
Eichelberger Family Trust and Eichelberger Scott A
Bought by
Jones Brandon and Jones Sadie
Current Estimated Value
Home Financials for this Owner
Home Financials are based on the most recent Mortgage that was taken out on this home.
Original Mortgage
$335,750
Outstanding Balance
$332,980
Interest Rate
6.54%
Mortgage Type
New Conventional
Estimated Equity
$49,125
Purchase Details
Closed on
Jul 8, 2024
Sold by
Maciel Rodrigo and Fonseca Mercedes
Bought by
Campbell Adam
Purchase Details
Closed on
Dec 29, 2015
Sold by
Nancy L Eichelberger Living Trust and Eichelberger Nancy L
Bought by
Eichelberger Family Trust and Eichelberger
Purchase Details
Closed on
Jun 14, 2011
Bought by
Eichelberger Larry L and Eichelberger Nancy L
Create a Home Valuation Report for This Property
The Home Valuation Report is an in-depth analysis detailing your home's value as well as a comparison with similar homes in the area
Home Values in the Area
Average Home Value in this Area
Purchase History
| Date | Buyer | Sale Price | Title Company |
|---|---|---|---|
| Jones Brandon | $395,000 | None Listed On Document | |
| Jones Brandon | $395,000 | None Listed On Document | |
| Campbell Adam | $157,000 | None Listed On Document | |
| Eichelberger Family Trust | -- | None Listed On Document | |
| Eichelberger Larry L | -- | -- |
Source: Public Records
Mortgage History
| Date | Status | Borrower | Loan Amount |
|---|---|---|---|
| Open | Jones Brandon | $335,750 | |
| Closed | Jones Brandon | $335,750 |
Source: Public Records
Tax History Compared to Growth
Tax History
| Year | Tax Paid | Tax Assessment Tax Assessment Total Assessment is a certain percentage of the fair market value that is determined by local assessors to be the total taxable value of land and additions on the property. | Land | Improvement |
|---|---|---|---|---|
| 2024 | $3,663 | $298,675 | $11,040 | $287,635 |
| 2023 | $4,624 | $298,675 | $11,040 | $287,635 |
| 2022 | $4,866 | $298,675 | $11,040 | $287,635 |
| 2021 | $4,480 | $280,110 | $11,040 | $269,070 |
| 2020 | $4,293 | $280,110 | $11,040 | $269,070 |
| 2019 | $3,965 | $280,110 | $11,040 | $269,070 |
| 2018 | $3,876 | $263,705 | $11,040 | $252,665 |
| 2017 | $3,834 | $263,705 | $11,040 | $252,665 |
| 2016 | $3,415 | $247,640 | $7,850 | $239,790 |
| 2015 | $3,308 | $247,640 | $7,850 | $239,790 |
| 2014 | $3,299 | $247,640 | $7,850 | $239,790 |
| 2013 | $3,490 | $227,225 | $7,850 | $219,375 |
Source: Public Records
Map
Nearby Homes