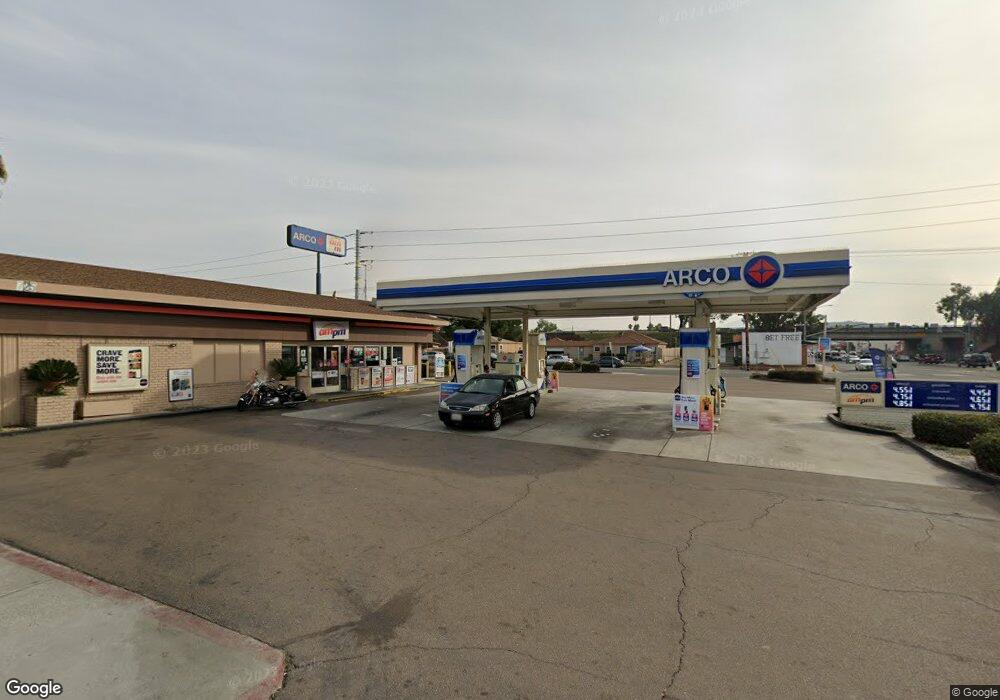
725 N 2nd St El Cajon, CA 92021
Estimated Value: $3,241,292
--
Bed
--
Bath
1,716
Sq Ft
$1,889/Sq Ft
Est. Value
About This Home
This home is located at 725 N 2nd St, El Cajon, CA 92021 and is currently estimated at $3,241,292, approximately $1,888 per square foot. 725 N 2nd St is a home located in San Diego County with nearby schools including Madison Avenue Elementary School, Greenfield Middle School, and El Cajon Valley High School.
Ownership History
Date
Name
Owned For
Owner Type
Purchase Details
Closed on
May 10, 2013
Sold by
Big Daddys Oil 20 Inc
Bought by
Poliza Oil Company Inc
Current Estimated Value
Home Financials for this Owner
Home Financials are based on the most recent Mortgage that was taken out on this home.
Original Mortgage
$1,435,000
Interest Rate
4.49%
Mortgage Type
Commercial
Purchase Details
Closed on
May 5, 2013
Sold by
Bp West Coast Products Llc
Bought by
Big Daddys Oil 20 Inc
Home Financials for this Owner
Home Financials are based on the most recent Mortgage that was taken out on this home.
Original Mortgage
$1,435,000
Interest Rate
4.49%
Mortgage Type
Commercial
Purchase Details
Closed on
Dec 31, 2001
Sold by
Atlantic Richfield Company De
Bought by
Bp West Coast Products Llc
Create a Home Valuation Report for This Property
The Home Valuation Report is an in-depth analysis detailing your home's value as well as a comparison with similar homes in the area
Home Values in the Area
Average Home Value in this Area
Purchase History
| Date | Buyer | Sale Price | Title Company |
|---|---|---|---|
| Poliza Oil Company Inc | $1,540,000 | Commonwealth Land Title Co | |
| Big Daddys Oil 20 Inc | $1,538,000 | Lawyers Title Company | |
| Bp West Coast Products Llc | -- | Commonwealth Land Title Co |
Source: Public Records
Mortgage History
| Date | Status | Borrower | Loan Amount |
|---|---|---|---|
| Previous Owner | Poliza Oil Company Inc | $1,435,000 | |
| Previous Owner | Big Daddys Oil 20 Inc | $1,232,000 |
Source: Public Records
Tax History Compared to Growth
Tax History
| Year | Tax Paid | Tax Assessment Tax Assessment Total Assessment is a certain percentage of the fair market value that is determined by local assessors to be the total taxable value of land and additions on the property. | Land | Improvement |
|---|---|---|---|---|
| 2025 | $23,395 | $1,887,817 | $1,636,521 | $251,296 |
| 2024 | $23,395 | $1,850,802 | $1,604,433 | $246,369 |
| 2023 | $23,573 | $1,814,513 | $1,572,974 | $241,539 |
| 2022 | $22,392 | $1,778,935 | $1,542,132 | $236,803 |
| 2021 | $21,829 | $1,744,055 | $1,511,895 | $232,160 |
| 2020 | $21,907 | $1,726,173 | $1,496,393 | $229,780 |
| 2019 | $20,596 | $1,692,327 | $1,467,052 | $225,275 |
| 2018 | $20,262 | $1,659,145 | $1,438,287 | $220,858 |
| 2017 | $20,004 | $1,626,614 | $1,410,086 | $216,528 |
| 2016 | $19,206 | $1,594,721 | $1,382,438 | $212,283 |
| 2015 | $19,109 | $1,570,768 | $1,361,673 | $209,095 |
| 2014 | $18,792 | $1,544,780 | $1,323,581 | $221,199 |
Source: Public Records
Map
Nearby Homes
- 1321 Oakdale Ave
- 1386-90 Oakdale Ave
- 1278 E Madison Ave Unit D
- 1278 E Madison Ave Unit C
- 540 Oakdale Ln Unit C
- 540 Oakdale Ln Unit A
- 525 Shady Ln Unit D
- 1198 Evilo St
- 1386 E Madison Ave Unit 15
- 1386 E Madison Ave Unit 47
- 1386 E Madison Ave Unit 21
- 1434 Peach Ave
- 1429 Oakdale Ave
- 1088 Bostonia St Unit 7
- 1105 Bostonia St
- 1135 Peach Ave Unit C
- 1425 E Madison Ave Unit 18
- 1125 Evilo St
- 1131 Mary St
- 1349 E Main St
- 1320 Naranca Ave
- 1322 Naranca Ave
- 798 N 2nd St
- 1324 Naranca Ave
- 1315-1321 1315-1321 Naranca Ave
- 1315 Naranca Ave
- 1311-15 Marline Ave
- 1311 Marline Ave
- 1328 Naranca Ave Unit 30
- 1325 Naranca Ave
- 744/770 N 2nd St
- 744 N 2nd St
- 1317 Marline Ave
- 1329 Naranca Ave
- 780 N 2nd St
- 1332 Naranca Ave
- 0 Marline Ave
- 1319 Marline Ave Unit A
- 1294 Naranca Ave
- 801-813 801-813 N 2nd St