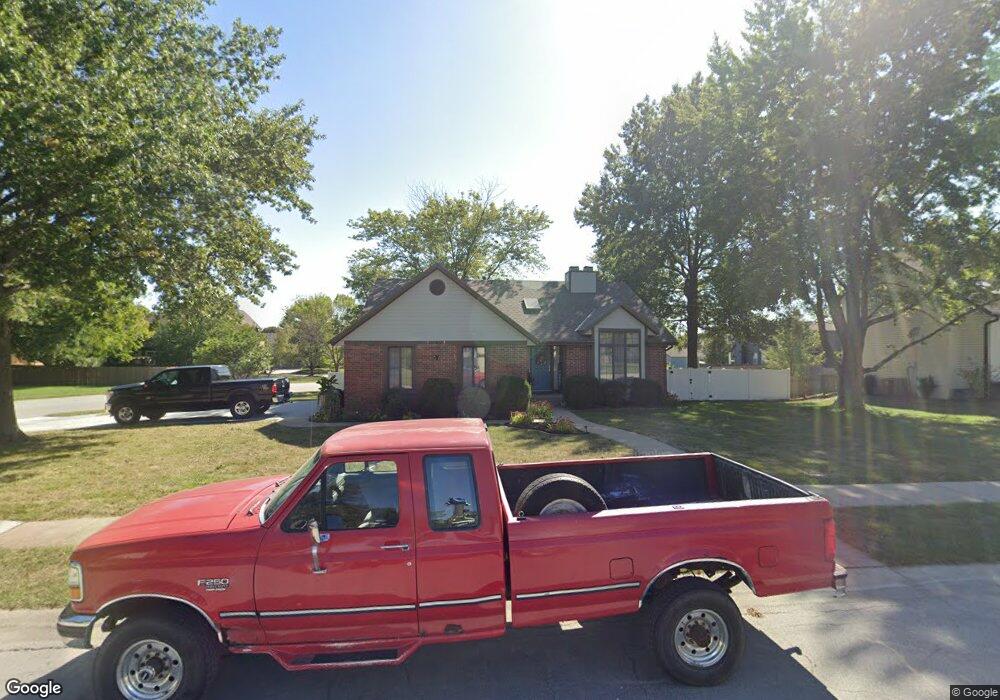
725 SE 11th St Lees Summit, MO 64081
Estimated Value: $371,000 - $413,000
4
Beds
3
Baths
2,386
Sq Ft
$163/Sq Ft
Est. Value
About This Home
This home is located at 725 SE 11th St, Lees Summit, MO 64081 and is currently estimated at $389,500, approximately $163 per square foot. 725 SE 11th St is a home located in Jackson County with nearby schools including Sunset Valley Elementary School, Pleasant Lea Middle School, and Lee's Summit Senior High School.
Ownership History
Date
Name
Owned For
Owner Type
Purchase Details
Closed on
Jun 6, 2015
Sold by
Smith Marion
Bought by
Smith Marion and Smith Robin
Current Estimated Value
Purchase Details
Closed on
Sep 19, 2008
Sold by
Smith Deborah E
Bought by
Smith Marion D
Home Financials for this Owner
Home Financials are based on the most recent Mortgage that was taken out on this home.
Original Mortgage
$144,000
Interest Rate
5.8%
Mortgage Type
Stand Alone Refi Refinance Of Original Loan
Purchase Details
Closed on
Jan 27, 1998
Sold by
Mather Mark S and Mather Kristin T
Bought by
Smith Marion D and Smith Deborah E
Home Financials for this Owner
Home Financials are based on the most recent Mortgage that was taken out on this home.
Original Mortgage
$115,425
Interest Rate
7.07%
Mortgage Type
Purchase Money Mortgage
Create a Home Valuation Report for This Property
The Home Valuation Report is an in-depth analysis detailing your home's value as well as a comparison with similar homes in the area
Home Values in the Area
Average Home Value in this Area
Purchase History
| Date | Buyer | Sale Price | Title Company |
|---|---|---|---|
| Smith Marion | -- | None Available | |
| Smith Marion D | -- | None Available | |
| Smith Marion D | -- | Old Republic Title Company |
Source: Public Records
Mortgage History
| Date | Status | Borrower | Loan Amount |
|---|---|---|---|
| Previous Owner | Smith Marion D | $144,000 | |
| Previous Owner | Smith Marion D | $115,425 |
Source: Public Records
Tax History Compared to Growth
Tax History
| Year | Tax Paid | Tax Assessment Tax Assessment Total Assessment is a certain percentage of the fair market value that is determined by local assessors to be the total taxable value of land and additions on the property. | Land | Improvement |
|---|---|---|---|---|
| 2025 | $4,069 | $48,245 | $10,072 | $38,173 |
| 2024 | $4,069 | $56,348 | $10,357 | $45,991 |
| 2023 | $4,039 | $56,348 | $7,345 | $49,003 |
| 2022 | $2,945 | $36,480 | $3,336 | $33,144 |
| 2021 | $3,006 | $36,480 | $3,336 | $33,144 |
| 2020 | $2,895 | $34,798 | $3,336 | $31,462 |
| 2019 | $2,816 | $34,798 | $3,336 | $31,462 |
| 2018 | $1,007,171 | $30,285 | $2,903 | $27,382 |
| 2017 | $2,641 | $30,285 | $2,903 | $27,382 |
| 2016 | $2,558 | $29,032 | $3,268 | $25,764 |
| 2014 | $2,578 | $28,681 | $3,258 | $25,423 |
Source: Public Records
Map
Nearby Homes
- 705 SE 11th Terrace
- 727 SE 10th St
- 1314 SE Norwood Dr
- 1335 SE Lexington Ave Unit C
- 1313 SE Broadway Cir Unit B
- 1335 SE Broadway Cir
- 1412 SE Lexington Ave
- 1407 SE Norwood Dr
- 1016 SE Claremont St
- 1020 SE 11th St
- 1021 SE 12th St
- 707 SE 14th St
- 1116 SE 7th St
- 1224 SE Windbreak Dr
- 1222 SE Windbreak Dr
- 1212 SE Windbreak Dr
- 1210 SE Windbreak Dr
- 1624 SE Dalton Dr
- 1400 SE 7th St
- 1218 SE Windbreak Dr
- 721 SE 11th St
- 724 SE 11th St
- 0 Bridgehampton N A Unit 1672446
- 0 Bridgehampton N A Unit 1695339
- 728 SE 11th St
- 720 SE 11th Terrace
- 717 SE 11th St
- 720 SE 11th St
- 801 SE 11th St
- 804 SE 11th Terrace
- 716 SE 11th St
- 716 SE 11th Terrace
- 713 SE 11th St
- 808 SE 11th Terrace
- 805 SE 11th St
- 712 SE 11th Terrace
- 712 SE 11th St
- 800 SE 11th St
- 801 SE 11th Terrace
- 812 SE 11th Terrace