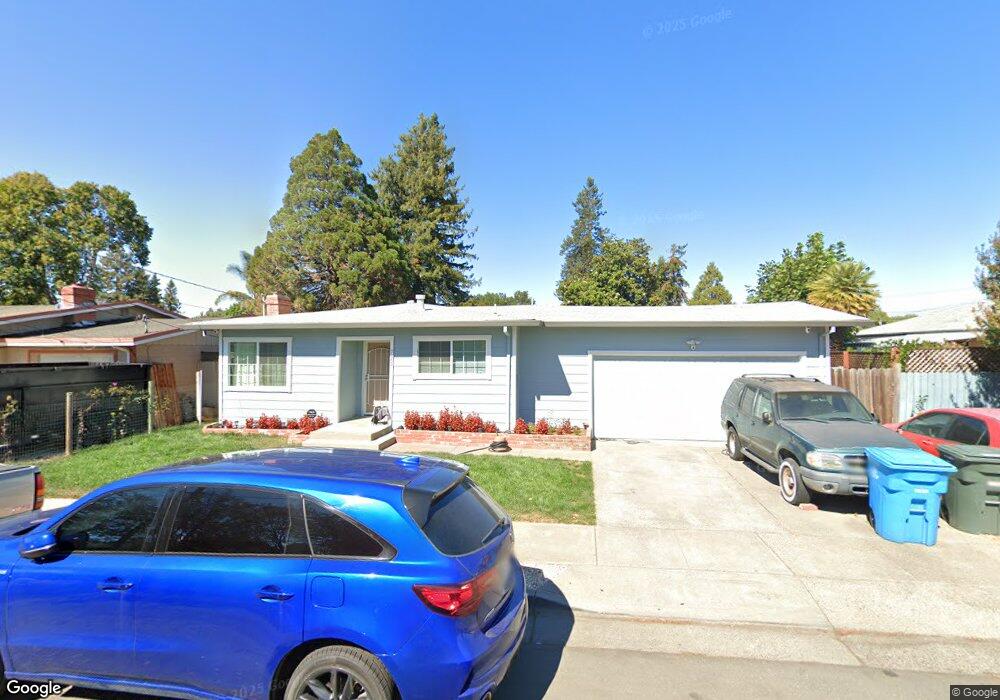
725 Sunny Manor Way Santa Rosa, CA 95401
Estimated Value: $477,000 - $656,000
3
Beds
2
Baths
1,144
Sq Ft
$497/Sq Ft
Est. Value
About This Home
This home is located at 725 Sunny Manor Way, Santa Rosa, CA 95401 and is currently estimated at $568,560, approximately $496 per square foot. 725 Sunny Manor Way is a home located in Sonoma County with nearby schools including Abraham Lincoln Elementary School, Santa Rosa Middle School, and Santa Rosa High School.
Ownership History
Date
Name
Owned For
Owner Type
Purchase Details
Closed on
Nov 3, 2005
Sold by
Ramos Daniel A
Bought by
Ramos Sovuthy M
Current Estimated Value
Home Financials for this Owner
Home Financials are based on the most recent Mortgage that was taken out on this home.
Original Mortgage
$95,250
Outstanding Balance
$53,551
Interest Rate
6.47%
Mortgage Type
New Conventional
Estimated Equity
$515,009
Purchase Details
Closed on
Dec 16, 1996
Sold by
Uchytil Ronald L and Uchytil Marylan A
Bought by
Ramos Daniel A and Ramos Sovuthy M
Home Financials for this Owner
Home Financials are based on the most recent Mortgage that was taken out on this home.
Original Mortgage
$101,250
Interest Rate
10.15%
Purchase Details
Closed on
Nov 29, 1989
Sold by
Uchytil Ronald L and Uchytil Marylan A
Bought by
Uchytil Ronald L and Uchytil Marylan A
Create a Home Valuation Report for This Property
The Home Valuation Report is an in-depth analysis detailing your home's value as well as a comparison with similar homes in the area
Home Values in the Area
Average Home Value in this Area
Purchase History
| Date | Buyer | Sale Price | Title Company |
|---|---|---|---|
| Ramos Sovuthy M | -- | Chicago Title Co | |
| Ramos Daniel A | $135,000 | North American Title Co | |
| Uchytil Ronald L | -- | -- |
Source: Public Records
Mortgage History
| Date | Status | Borrower | Loan Amount |
|---|---|---|---|
| Open | Ramos Sovuthy M | $95,250 | |
| Closed | Ramos Daniel A | $101,250 |
Source: Public Records
Tax History Compared to Growth
Tax History
| Year | Tax Paid | Tax Assessment Tax Assessment Total Assessment is a certain percentage of the fair market value that is determined by local assessors to be the total taxable value of land and additions on the property. | Land | Improvement |
|---|---|---|---|---|
| 2025 | $2,434 | $220,171 | $97,851 | $122,320 |
| 2024 | $2,434 | $215,855 | $95,933 | $119,922 |
| 2023 | $2,434 | $211,623 | $94,052 | $117,571 |
| 2022 | $2,246 | $207,474 | $92,208 | $115,266 |
| 2021 | $2,218 | $203,406 | $90,400 | $113,006 |
| 2020 | $2,212 | $201,322 | $89,474 | $111,848 |
| 2019 | $2,199 | $197,375 | $87,720 | $109,655 |
| 2018 | $2,185 | $193,505 | $86,000 | $107,505 |
| 2017 | $2,144 | $189,712 | $84,314 | $105,398 |
| 2016 | $2,120 | $185,993 | $82,661 | $103,332 |
| 2015 | $2,056 | $183,200 | $81,420 | $101,780 |
| 2014 | $1,929 | $179,613 | $79,826 | $99,787 |
Source: Public Records
Map
Nearby Homes
- 904 Renee Ct
- 919 Kingwood St
- 493 Umland Dr
- 930 Kingwood St
- 706 Simpson Place
- 788 Simpson Place
- 415 Duncan St
- 303 Hewett St
- 759 Simpson Place
- 595 N Dutton Ave
- 223 Decker St
- 713 Blair Place
- 1001 Damon Ct
- 164 N Dutton Ave Unit 7
- 139 Sandalwood Ct
- 1239 Eardley Ave
- 100 W 8th St
- 300 Stony Point Rd Unit 144
- 1538 Surrey Dr
- 743 Davis St
- 731 Sunny Manor Way
- 709 Sterling Ct
- 733 Sunny Manor Way
- 720 Link Ln
- 728 Sunny Manor Way
- 715 Sterling Ct
- 722 Sunny Manor Way
- 732 Sunny Manor Way
- 704 Sterling Ct
- 810 Link Ln
- 716 Sunny Manor Way
- 738 Sunny Manor Way
- 816 Link Ln
- 658 Sunny Manor Way
- 710 Sterling Ct
- 718 Palomino Dr
- 633 Sunny Manor Way
- 722 Palomino Dr
- 714 Palomino Dr
- 717 W 8th St