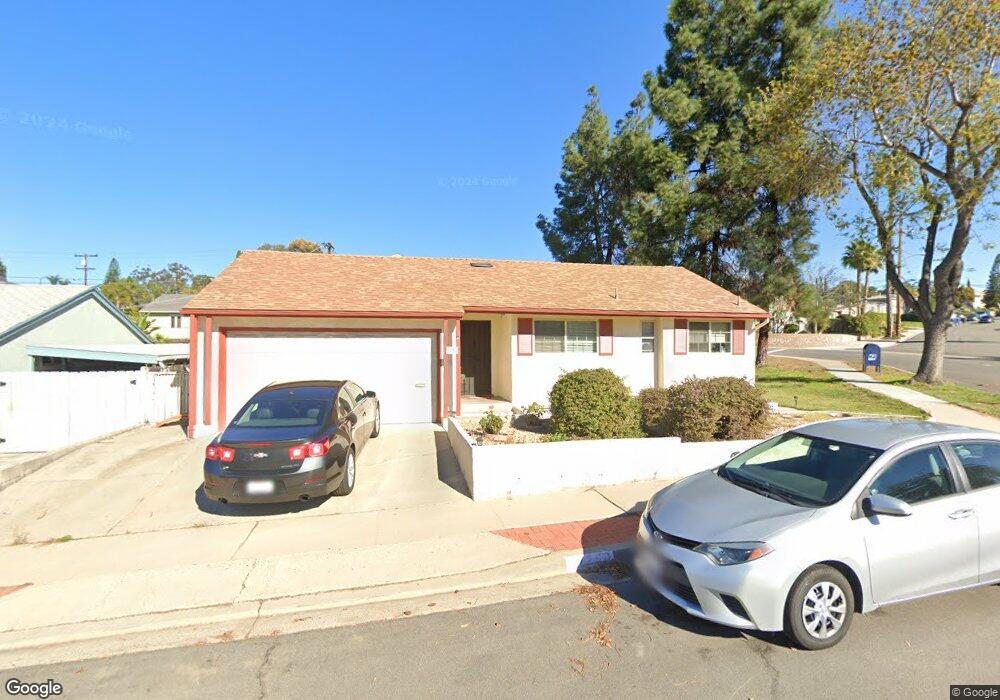
7250 Grable St La Mesa, CA 91942
Estimated Value: $876,000 - $991,000
4
Beds
2
Baths
1,703
Sq Ft
$534/Sq Ft
Est. Value
About This Home
This home is located at 7250 Grable St, La Mesa, CA 91942 and is currently estimated at $909,907, approximately $534 per square foot. 7250 Grable St is a home located in San Diego County with nearby schools including Maryland Avenue Elementary School, Parkway Academy, and Grossmont High School.
Ownership History
Date
Name
Owned For
Owner Type
Purchase Details
Closed on
Mar 8, 1999
Sold by
Villani Patsy
Bought by
Proo Michael A and Proo Tracey R
Current Estimated Value
Home Financials for this Owner
Home Financials are based on the most recent Mortgage that was taken out on this home.
Original Mortgage
$194,873
Outstanding Balance
$47,083
Interest Rate
6.73%
Estimated Equity
$862,824
Purchase Details
Closed on
Dec 31, 1996
Sold by
Ruden Irma 1989 Trust and Ellen Debra
Bought by
Villani Giuseppe and Villani Patsy
Home Financials for this Owner
Home Financials are based on the most recent Mortgage that was taken out on this home.
Original Mortgage
$110,000
Interest Rate
7.53%
Create a Home Valuation Report for This Property
The Home Valuation Report is an in-depth analysis detailing your home's value as well as a comparison with similar homes in the area
Purchase History
| Date | Buyer | Sale Price | Title Company |
|---|---|---|---|
| Proo Michael A | $201,000 | Commonwealth Land Title Co | |
| Villani Giuseppe | $160,000 | Commonwealth Land Title Co |
Source: Public Records
Mortgage History
| Date | Status | Borrower | Loan Amount |
|---|---|---|---|
| Open | Proo Michael A | $194,873 | |
| Previous Owner | Villani Giuseppe | $110,000 |
Source: Public Records
Tax History
| Year | Tax Paid | Tax Assessment Tax Assessment Total Assessment is a certain percentage of the fair market value that is determined by local assessors to be the total taxable value of land and additions on the property. | Land | Improvement |
|---|---|---|---|---|
| 2025 | $4,617 | $314,929 | $109,728 | $205,201 |
| 2024 | $4,617 | $308,755 | $107,577 | $201,178 |
| 2023 | $4,479 | $302,702 | $105,468 | $197,234 |
| 2022 | $4,411 | $296,767 | $103,400 | $193,367 |
| 2021 | $4,209 | $290,949 | $101,373 | $189,576 |
| 2020 | $4,100 | $287,967 | $100,334 | $187,633 |
| 2019 | $4,065 | $282,321 | $98,367 | $183,954 |
| 2018 | $4,005 | $276,787 | $96,439 | $180,348 |
| 2017 | $50 | $271,361 | $94,549 | $176,812 |
| 2016 | $3,813 | $266,042 | $92,696 | $173,346 |
| 2015 | $3,774 | $262,047 | $91,304 | $170,743 |
| 2014 | $3,693 | $256,915 | $89,516 | $167,399 |
Source: Public Records
Map
Nearby Homes
- 7225 Baldrich St
- 7495 Oakland Rd Unit 50
- 7495 Oakland Rd Unit 23
- 7508 Parkway Dr Unit 102
- 7003 Saranac St Unit 203
- 7009 Wyoming Ave
- 5525 Shasta Ln Unit 301
- 5525 Shasta Ln Unit 310
- 5590 Shasta Ln
- 6955 Alvarado Rd Unit 30
- 6955 Alvarado Rd Unit 70
- 6901 Alvarado Rd Unit 9
- 7105 Amherst St
- 5430 Baltimore Dr Unit 51
- 5430 Baltimore Dr Unit 70
- 6979-81 Amherst St
- 6851 Alvarado Rd Unit 21
- 4862 70th St
- 4800 Williamsburg Ln Unit 227
- 5254 Bocaw Place
- 7240 Grable St
- 7255 Magruder St
- 7245 Magruder St
- 7230 Grable St
- 5265 Maryland Ave
- 5305 Kiowa Dr
- 7245 Grable St
- 7235 Magruder St
- 5255 Maryland Ave
- 5269 Maryland Ave
- 7220 Grable St
- 7235 Grable St
- 5315 Kiowa Dr
- 7225 Magruder St
- 5284 Maryland Ave
- 5260 Guessman Ave
- 5240 Maryland Ave
- 5245 Maryland Ave
- 7225 Grable St
- 5250 Guessman Ave
Your Personal Tour Guide
Ask me questions while you tour the home.