Estimated Value: $532,000 - $7,523,396
11
Beds
8
Baths
5,371
Sq Ft
$750/Sq Ft
Est. Value
About This Home
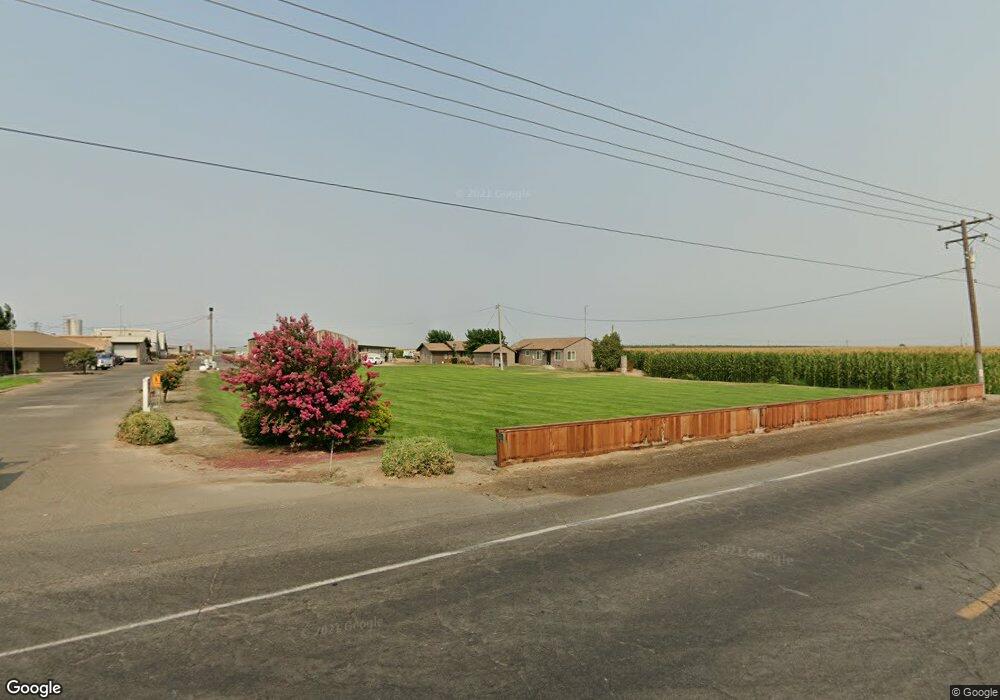
This home is located at 7251 Crows Landing Rd, Ceres, CA 95307 and is currently estimated at $4,027,698, approximately $749 per square foot. 7251 Crows Landing Rd is a home located in Stanislaus County with nearby schools including Westport Elementary School, Blaker-Kinser Junior High School, and Central Valley High School.
Ownership History
Date
Name
Owned For
Owner Type
Purchase Details
Closed on
Jun 11, 2019
Sold by
Trinkler Dellis Rita
Bought by
Trinkler 2013 Revocable Trust
Current Estimated Value
Purchase Details
Closed on
Sep 25, 2017
Sold by
Trinkler Wendel C
Bought by
Dellis Rita Trinkler
Purchase Details
Closed on
Mar 28, 2013
Sold by
Trinkler Wendel C and Trinkler Wendel K
Bought by
Trinkler Wendel K
Purchase Details
Closed on
Nov 20, 2012
Sold by
Trinkler Heide A
Bought by
Trinkler Wendel C
Purchase Details
Closed on
Oct 4, 2012
Sold by
Trinkler Wendel C
Bought by
Trinkler Wendel C
Purchase Details
Closed on
May 15, 2012
Sold by
Trinkler Wendel C
Bought by
Trinkler Wendel C
Create a Home Valuation Report for This Property
The Home Valuation Report is an in-depth analysis detailing your home's value as well as a comparison with similar homes in the area
Purchase History
| Date | Buyer | Sale Price | Title Company |
|---|---|---|---|
| Trinkler 2013 Revocable Trust | $5,285,255 | None Available | |
| Dellis Rita Trinkler | $454,000 | None Available | |
| Trinkler Wendel K | $454,000 | None Available | |
| Trinkler Wendel K | -- | None Available | |
| Trinkler Wendel C | -- | Chicago Title Company | |
| Dellis Rita Trinkler | -- | Chicago Title Company | |
| Trinkler Wendel C | $908,000 | None Available | |
| Trinkler Wendel C | -- | None Available | |
| Trinkler Wendel C | -- | None Available |
Source: Public Records
Tax History
| Year | Tax Paid | Tax Assessment Tax Assessment Total Assessment is a certain percentage of the fair market value that is determined by local assessors to be the total taxable value of land and additions on the property. | Land | Improvement |
|---|---|---|---|---|
| 2025 | $91,278 | $7,270,313 | $1,876,671 | $5,393,642 |
| 2024 | $87,787 | $7,314,873 | $2,016,709 | $5,298,164 |
| 2023 | $69,630 | $5,747,678 | $2,052,099 | $3,695,579 |
| 2022 | $58,484 | $4,850,135 | $2,126,078 | $2,724,057 |
| 2021 | $58,060 | $4,714,677 | $2,029,572 | $2,685,105 |
| 2020 | $55,439 | $4,621,990 | $1,920,224 | $2,701,766 |
| 2019 | $55,597 | $4,643,998 | $1,765,223 | $2,878,775 |
| 2018 | $49,599 | $4,258,909 | $1,363,245 | $2,895,664 |
| 2017 | $47,677 | $4,050,450 | $1,211,543 | $2,838,907 |
| 2016 | $46,137 | $3,989,381 | $1,156,789 | $2,832,592 |
| 2015 | $46,549 | $4,017,320 | $1,155,838 | $2,861,482 |
| 2014 | $45,782 | $3,952,243 | $1,105,510 | $2,846,733 |
Source: Public Records
Map
Nearby Homes
- 1237 W Keyes Rd
- 5237 Crows Landing Rd
- 2030 E Grayson Rd Unit 42
- 2030 E Grayson Rd Unit 44
- 2030 E Grayson Rd Unit 26
- 2030 E Grayson Rd Unit 41
- 4396 Admiral Ct
- 4376 Admiral Ct
- 1279 Montclaire Dr
- 8631 Mitchell Rd
- 4449 S Carpenter Rd Unit B12
- 4449 S Carpenter Rd Unit C-1
- 1440 Don Pedro Rd
- 3816 Teek Ct
- 3608 Cassie Ln
- 3816 Dano Ct
- 3449 Guru Dr
- 1628 Sungate Dr
- 954 Avenida Real
- 3939 Central Ave Unit 157
- 7018 Crows Landing Rd
- 0 Crows Landing Rd Unit 90096928
- 0 Crows Landing Rd Unit 14051894
- 0 Crows Landing Rd Unit 222095730
- 0 Crows Landing Rd Unit 20076647
- 7000 Crows Landing Rd
- 124 E Taylor Rd
- 206 E Zeering Rd
- 148 E Taylor Rd
- 212 E Taylor Rd
- 230 E Taylor Rd
- 242 E Taylor Rd
- 412 W Zeering Rd
- 354 E Taylor Rd
- 131 E Taylor Rd
- 300 E Taylor Rd
- 137 E Taylor Rd
- 201 E Taylor Rd
- 6918 Crows Landing Rd
Your Personal Tour Guide
Ask me questions while you tour the home.