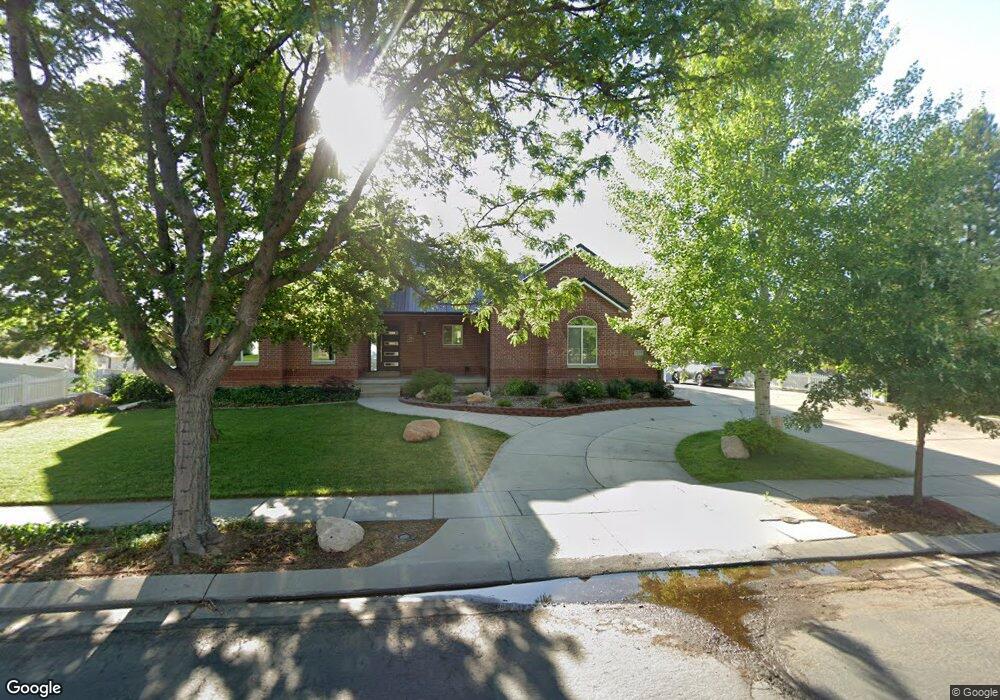
7253 Tico Dr West Jordan, UT 84081
Shadow Mountain NeighborhoodEstimated Value: $691,000 - $759,000
2
Beds
3
Baths
1,917
Sq Ft
$384/Sq Ft
Est. Value
About This Home
This home is located at 7253 Tico Dr, West Jordan, UT 84081 and is currently estimated at $735,780, approximately $383 per square foot. 7253 Tico Dr is a home located in Salt Lake County with nearby schools including Mountain Shadows School, West Hills Middle School, and Copper Hills High School.
Ownership History
Date
Name
Owned For
Owner Type
Purchase Details
Closed on
Sep 29, 2016
Sold by
Cook Daniel M
Bought by
Hill Jeremy W and Hill Linh T
Current Estimated Value
Home Financials for this Owner
Home Financials are based on the most recent Mortgage that was taken out on this home.
Original Mortgage
$329,062
Outstanding Balance
$263,554
Interest Rate
3.43%
Mortgage Type
VA
Estimated Equity
$472,226
Purchase Details
Closed on
Mar 22, 1999
Sold by
Alva Shonna
Bought by
Cook Daniel
Purchase Details
Closed on
Mar 19, 1997
Sold by
Bowler Realty Inc
Bought by
Alva Shonna
Home Financials for this Owner
Home Financials are based on the most recent Mortgage that was taken out on this home.
Original Mortgage
$33,375
Interest Rate
7.74%
Create a Home Valuation Report for This Property
The Home Valuation Report is an in-depth analysis detailing your home's value as well as a comparison with similar homes in the area
Home Values in the Area
Average Home Value in this Area
Purchase History
| Date | Buyer | Sale Price | Title Company |
|---|---|---|---|
| Hill Jeremy W | -- | United Title Services | |
| Cook Daniel | -- | Backman Stewart Title Servic | |
| Alva Shonna | -- | -- | |
| Bowler Realty Inc | -- | -- |
Source: Public Records
Mortgage History
| Date | Status | Borrower | Loan Amount |
|---|---|---|---|
| Open | Hill Jeremy W | $329,062 | |
| Previous Owner | Alva Shonna | $33,375 |
Source: Public Records
Tax History Compared to Growth
Tax History
| Year | Tax Paid | Tax Assessment Tax Assessment Total Assessment is a certain percentage of the fair market value that is determined by local assessors to be the total taxable value of land and additions on the property. | Land | Improvement |
|---|---|---|---|---|
| 2025 | $3,554 | $694,700 | $217,600 | $477,100 |
| 2024 | $3,554 | $683,700 | $209,200 | $474,500 |
| 2023 | $3,307 | $599,700 | $201,200 | $398,500 |
| 2022 | $3,481 | $620,900 | $197,300 | $423,600 |
| 2021 | $3,080 | $500,200 | $151,800 | $348,400 |
| 2020 | $2,894 | $441,100 | $139,600 | $301,500 |
| 2019 | $2,934 | $438,500 | $131,700 | $306,800 |
| 2018 | $2,682 | $397,600 | $131,700 | $265,900 |
| 2017 | $2,525 | $372,600 | $131,700 | $240,900 |
| 2016 | $2,533 | $351,200 | $138,300 | $212,900 |
| 2015 | $2,519 | $340,500 | $148,100 | $192,400 |
| 2014 | $2,457 | $327,000 | $143,400 | $183,600 |
Source: Public Records
Map
Nearby Homes
- 7288 Comet Hill Cir
- 7414 Regal Hill Dr
- 5208 W Case Mountain Rd
- 5151 Case Mountain Rd
- 7563 S Opal Mountain Way W Unit 306
- 7567 S Opal Mountain Way W Unit 307
- 7556 S Opal Mountain Way W Unit 311
- 7569 S Opal Mountain Way W Unit 308
- 7554 S Opal Mountain Way W Unit 310
- 7553 S Opal Mountain Way W Unit 302
- 7043 Orion Hill Rd
- 7043 S Orion Hill Rd
- Cleveland Plan at Bingham Heights
- McKinley Plan at Bingham Heights
- Ash Plan at Bingham Heights
- Cedar Plan at Bingham Heights
- Reagan Plan at Bingham Heights
- Monroe Plan at Bingham Heights
- Linden Plan at Bingham Heights
- Balsam Plan at Bingham Heights
- 7253 S Tico Dr
- 7237 Tico Dr
- 7267 Tico Dr
- 7248 Tico Dr
- 7262 Tico Dr
- 7232 Tico Dr
- 7281 Tico Dr
- 5304 Meteor Hill Cove
- 7223 Tico Dr
- 7276 Tico Dr
- 5311 Cygnus Hill Cove
- 7262 S Tico Dr
- 7297 Tico Dr
- 7297 S Tico Dr
- 7232 S Tico Dr
- 7207 Tico Dr
- 7216 Tico Dr
- 5292 Meteor Hill Cove
- 5301 Cygnus Hill Cove
- 7292 Tico Dr