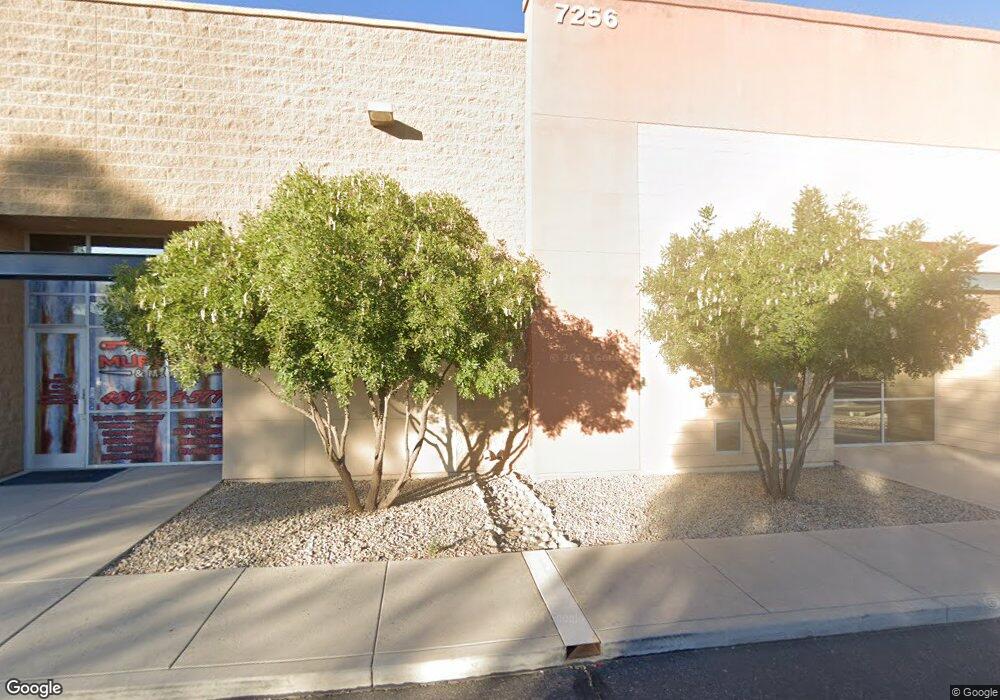
7256 S 89th Place Unit 101 Mesa, AZ 85212
Phoenix-Mesa Gateway NeighborhoodEstimated Value: $584,787
--
Bed
--
Bath
2,200
Sq Ft
$266/Sq Ft
Est. Value
About This Home
This home is located at 7256 S 89th Place Unit 101, Mesa, AZ 85212 and is currently estimated at $584,787, approximately $265 per square foot. 7256 S 89th Place Unit 101 is a home located in Maricopa County with nearby schools including Jack Barnes Elementary School, Queen Creek Junior High School, and Benjamin Franklin Charter School - Crismon.
Ownership History
Date
Name
Owned For
Owner Type
Purchase Details
Closed on
Sep 16, 2022
Sold by
Marlye Properties Llc
Bought by
Legacy Aero Partners Llc
Current Estimated Value
Purchase Details
Closed on
Mar 31, 2014
Sold by
Arcus Loan Fund I Llc
Bought by
Marlye Properties Llc
Home Financials for this Owner
Home Financials are based on the most recent Mortgage that was taken out on this home.
Original Mortgage
$161,755
Interest Rate
4.25%
Mortgage Type
Commercial
Purchase Details
Closed on
Feb 20, 2013
Sold by
Nelson One Llc
Bought by
Arcus Loan Fund I Llc
Purchase Details
Closed on
Jun 28, 2010
Sold by
Arcus Loan Fund I Llc
Bought by
Nelson One Llc
Home Financials for this Owner
Home Financials are based on the most recent Mortgage that was taken out on this home.
Original Mortgage
$166,012
Interest Rate
4.82%
Mortgage Type
Seller Take Back
Create a Home Valuation Report for This Property
The Home Valuation Report is an in-depth analysis detailing your home's value as well as a comparison with similar homes in the area
Home Values in the Area
Average Home Value in this Area
Purchase History
| Date | Buyer | Sale Price | Title Company |
|---|---|---|---|
| Legacy Aero Partners Llc | $598,456 | Landmark Title | |
| Marlye Properties Llc | $200,000 | Old Republic Title Agency | |
| Arcus Loan Fund I Llc | $188,200 | None Available | |
| Nelson One Llc | $195,312 | Old Republic Title Agency |
Source: Public Records
Mortgage History
| Date | Status | Borrower | Loan Amount |
|---|---|---|---|
| Previous Owner | Marlye Properties Llc | $161,755 | |
| Previous Owner | Nelson One Llc | $166,012 |
Source: Public Records
Tax History Compared to Growth
Tax History
| Year | Tax Paid | Tax Assessment Tax Assessment Total Assessment is a certain percentage of the fair market value that is determined by local assessors to be the total taxable value of land and additions on the property. | Land | Improvement |
|---|---|---|---|---|
| 2025 | $3,960 | $41,924 | -- | -- |
| 2024 | $4,451 | $41,175 | -- | -- |
| 2023 | $4,451 | $58,565 | $11,713 | $46,852 |
| 2022 | $4,431 | $54,250 | $10,850 | $43,400 |
| 2021 | $4,723 | $53,748 | $10,746 | $43,002 |
| 2020 | $4,584 | $51,768 | $10,350 | $41,418 |
| 2019 | $4,437 | $46,188 | $9,234 | $36,954 |
| 2018 | $4,233 | $42,030 | $8,406 | $33,624 |
| 2017 | $4,054 | $35,280 | $7,056 | $28,224 |
| 2016 | $4,053 | $32,040 | $6,408 | $25,632 |
| 2015 | $3,418 | $33,023 | $6,605 | $26,418 |
Source: Public Records
Map
Nearby Homes
- 20873 E Seagull Dr
- 20904 E Swan Dr
- 20852 E Kingbird Dr
- 21100 E Swan Dr
- 19436 S 208th Place
- Plan 3524 at Jorde Farms - Acclaim
- Plan 3521 at Jorde Farms - Acclaim
- Plan 3522 at Jorde Farms - Acclaim
- Plan 3523 at Jorde Farms - Acclaim
- 20915 E Cattle Dr
- Plan 4026 at Jorde Farms - Ascent
- Plan 4022 at Jorde Farms - Ascent
- Plan 4023 at Jorde Farms - Ascent
- Plan 4024 at Jorde Farms - Ascent
- 20682 E Canary Way
- 20762 E Canary Way
- 20729 E Canary Way
- 19338 S 212th Place
- 19789 E Willow Dr
- 19402 S 212th Place
- 7257 S Atwood Unit 110
- 7257 S Atwood Unit 103
- 7257 S Atwood Unit 113
- 7257 S Atwood Unit 105
- 7262 S Atwood Unit 12
- 7246 S Atwood Unit 13
- 7409 S 89th Place Unit 24
- 7427 S 89th Place Unit 25
- 8743 E Pecos Rd Unit 127
- 8757 E Woodland Ave
- 8743 E Woodland Ave
- 8758 E Waterford
- 8758 E Waterford Cir
- 8727 E Woodland Ave
- 7463 S 89th Place Unit 27
- 8744 E Waterford Cir
- 8759 E Waterford Cir
- 8715 E Woodland Ave
- 8730 E Waterford Cir
- 8745 E Waterford Cir