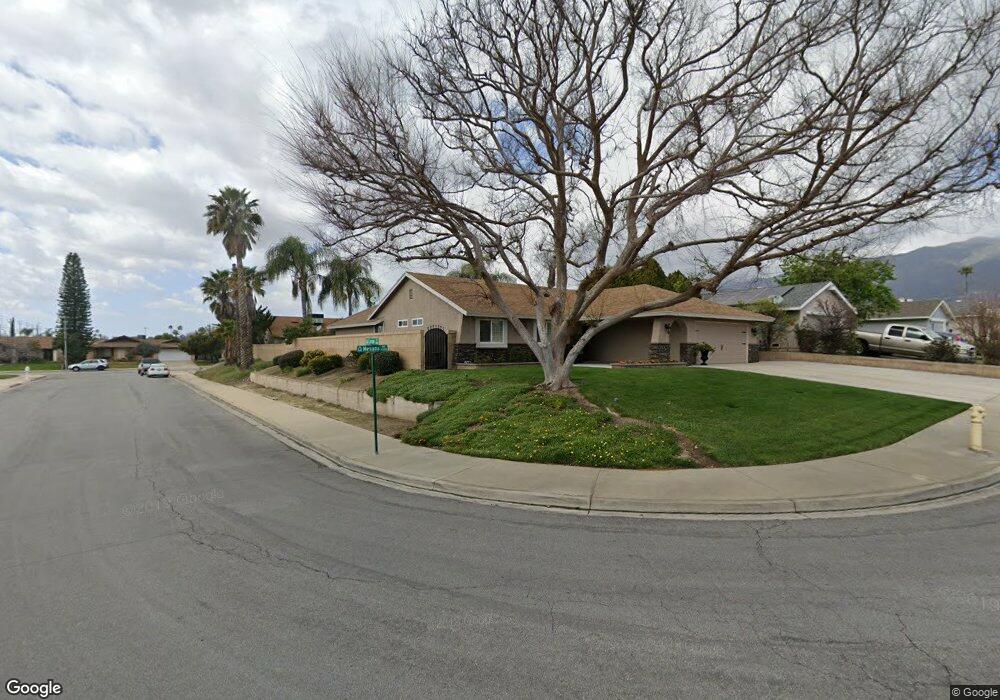
7258 Mesada St Rancho Cucamonga, CA 91701
Estimated Value: $796,827 - $863,000
4
Beds
3
Baths
2,132
Sq Ft
$395/Sq Ft
Est. Value
About This Home
This home is located at 7258 Mesada St, Rancho Cucamonga, CA 91701 and is currently estimated at $842,207, approximately $395 per square foot. 7258 Mesada St is a home located in San Bernardino County with nearby schools including Deer Canyon Elementary, Vineyard Junior High, and Los Osos High.
Ownership History
Date
Name
Owned For
Owner Type
Purchase Details
Closed on
Aug 12, 2020
Sold by
Telles Martin G and Telles Caroline J
Bought by
Telles Martin Gregory and Telles Caroline Jacqueline
Current Estimated Value
Purchase Details
Closed on
Mar 21, 2000
Sold by
Rodriguez Juan A
Bought by
Telles Martin G and Telles Caroline J
Home Financials for this Owner
Home Financials are based on the most recent Mortgage that was taken out on this home.
Original Mortgage
$168,300
Outstanding Balance
$56,916
Interest Rate
8.26%
Mortgage Type
VA
Estimated Equity
$785,291
Purchase Details
Closed on
Jun 19, 1998
Sold by
Rodriguez Juan A
Bought by
Rodriguez Juan A and Rodriguez Margaret Ann
Home Financials for this Owner
Home Financials are based on the most recent Mortgage that was taken out on this home.
Original Mortgage
$121,590
Interest Rate
8.49%
Mortgage Type
Assumption
Create a Home Valuation Report for This Property
The Home Valuation Report is an in-depth analysis detailing your home's value as well as a comparison with similar homes in the area
Home Values in the Area
Average Home Value in this Area
Purchase History
| Date | Buyer | Sale Price | Title Company |
|---|---|---|---|
| Telles Martin Gregory | -- | None Available | |
| Telles Martin G | $170,000 | Old Republic Title Company | |
| Rodriguez Juan A | -- | American Title |
Source: Public Records
Mortgage History
| Date | Status | Borrower | Loan Amount |
|---|---|---|---|
| Open | Telles Martin G | $168,300 | |
| Previous Owner | Rodriguez Juan A | $121,590 |
Source: Public Records
Tax History Compared to Growth
Tax History
| Year | Tax Paid | Tax Assessment Tax Assessment Total Assessment is a certain percentage of the fair market value that is determined by local assessors to be the total taxable value of land and additions on the property. | Land | Improvement |
|---|---|---|---|---|
| 2025 | $3,235 | $303,735 | $65,324 | $238,411 |
| 2024 | $3,235 | $297,779 | $64,043 | $233,736 |
| 2023 | $3,161 | $291,940 | $62,787 | $229,153 |
| 2022 | $3,151 | $286,216 | $61,556 | $224,660 |
| 2021 | $3,148 | $280,604 | $60,349 | $220,255 |
| 2020 | $3,096 | $277,727 | $59,730 | $217,997 |
| 2019 | $3,131 | $272,282 | $58,559 | $213,723 |
| 2018 | $3,061 | $266,943 | $57,411 | $209,532 |
| 2017 | $2,922 | $261,709 | $56,285 | $205,424 |
| 2016 | $2,843 | $256,577 | $55,181 | $201,396 |
| 2015 | $2,825 | $252,723 | $54,352 | $198,371 |
| 2014 | $2,746 | $247,772 | $53,287 | $194,485 |
Source: Public Records
Map
Nearby Homes
- 7208 Marine Ave
- 7314 Greenhaven Ave Unit 74
- 10350 Baseline Rd Unit 173
- 10350 Base Line Rd
- 10350 Base Line Rd Unit 192
- 7175 Summerfield Place
- 10627 Wildrose Dr
- 10669 Wildrose Dr
- 10650 Grandview Dr
- 7355 Ambrosia Rd
- 7224 Parkside Place
- 10487 Balsa St
- 10210 Baseline Rd Unit 62
- 10210 Baseline Rd Unit 115
- 10210 Baseline Rd Unit 289
- 7055 Mango St
- 6959 Center Ave
- 10781 La Vine St
- 6842 Palm Dr
- 7688 Gainey Ct
- 7248 Mesada St
- 7259 Marine Ave
- 7238 Mesada St
- 7249 Marine Ave
- 10455 Cordon Dr
- 10465 Cordon Dr
- 10445 Cordon Dr
- 7241 Marine Ave
- 7259 Mesada St
- 7230 Mesada St
- 7249 Mesada St
- 7269 Mesada St
- 10435 Cordon Dr
- 10471 Cordon Dr
- 7239 Mesada St
- 7231 Marine Ave
- 7220 Mesada St
- 7229 Mesada St
- 7221 Marine Ave
- 7256 Marine Ave