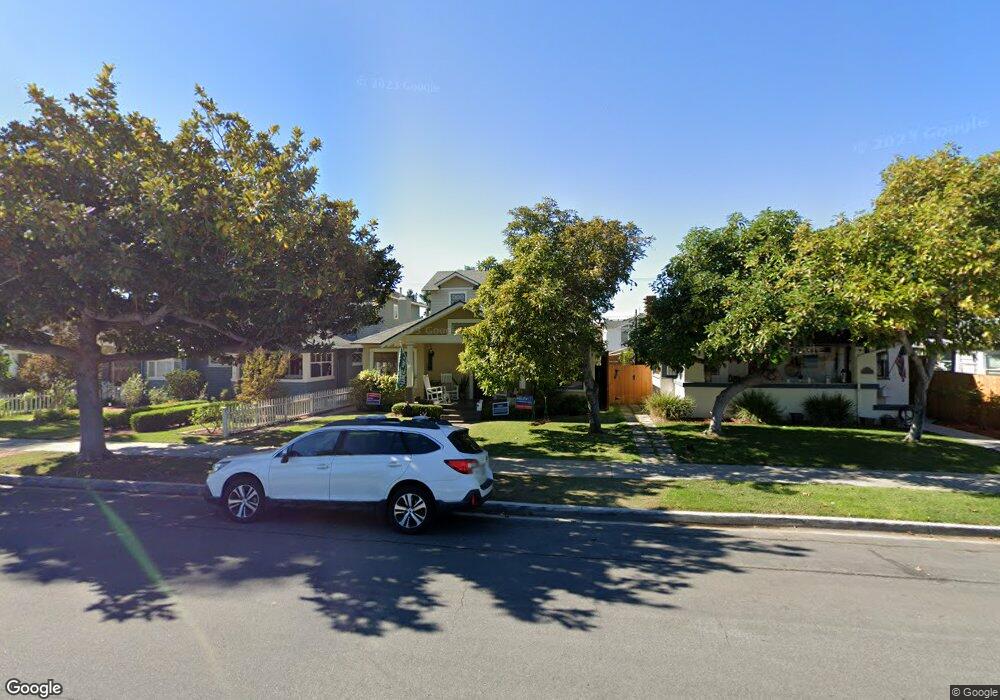
726 B Ave Coronado, CA 92118
Estimated Value: $3,037,000 - $3,849,000
5
Beds
3
Baths
2,600
Sq Ft
$1,334/Sq Ft
Est. Value
About This Home
This home is located at 726 B Ave, Coronado, CA 92118 and is currently estimated at $3,467,829, approximately $1,333 per square foot. 726 B Ave is a home located in San Diego County with nearby schools including Coronado Village Elementary, Coronado Middle School, and Coronado High School.
Ownership History
Date
Name
Owned For
Owner Type
Purchase Details
Closed on
Oct 26, 2019
Sold by
Braga Julia I
Bought by
Braga Julia I and Braga Fabio
Current Estimated Value
Home Financials for this Owner
Home Financials are based on the most recent Mortgage that was taken out on this home.
Original Mortgage
$210,000
Outstanding Balance
$185,112
Interest Rate
3.7%
Mortgage Type
Credit Line Revolving
Estimated Equity
$3,282,717
Purchase Details
Closed on
Sep 24, 2015
Sold by
Braga Fabio L
Bought by
Braga Julia I
Home Financials for this Owner
Home Financials are based on the most recent Mortgage that was taken out on this home.
Original Mortgage
$275,000
Interest Rate
3.87%
Mortgage Type
Adjustable Rate Mortgage/ARM
Purchase Details
Closed on
Dec 20, 2012
Sold by
Wiley Hope L
Bought by
Braga Julia I
Purchase Details
Closed on
May 13, 2010
Sold by
Muncy John
Bought by
Wiley Hope L and Hope L Wiley 2003 Family Trust
Purchase Details
Closed on
Feb 11, 2000
Sold by
Muncy Annabel C
Bought by
Muncy Annabel C and 2000 Annabel Muncy Living Trust
Create a Home Valuation Report for This Property
The Home Valuation Report is an in-depth analysis detailing your home's value as well as a comparison with similar homes in the area
Home Values in the Area
Average Home Value in this Area
Purchase History
| Date | Buyer | Sale Price | Title Company |
|---|---|---|---|
| Braga Julia I | -- | Servicelink | |
| Braga Julia I | -- | Fidelity National Title Co | |
| Braga Julia I | -- | None Available | |
| Wiley Hope L | $1,300,000 | Chicago Title Company | |
| Muncy Annabel C | -- | -- |
Source: Public Records
Mortgage History
| Date | Status | Borrower | Loan Amount |
|---|---|---|---|
| Open | Braga Julia I | $210,000 | |
| Closed | Braga Julia I | $275,000 |
Source: Public Records
Tax History
| Year | Tax Paid | Tax Assessment Tax Assessment Total Assessment is a certain percentage of the fair market value that is determined by local assessors to be the total taxable value of land and additions on the property. | Land | Improvement |
|---|---|---|---|---|
| 2025 | $8,025 | $1,792,488 | $1,075,492 | $716,996 |
| 2024 | $8,025 | $710,691 | $370,221 | $340,470 |
| 2023 | $8,854 | $787,271 | $417,270 | $370,001 |
| 2022 | $11,324 | $1,022,005 | $559,191 | $462,814 |
| 2021 | $11,101 | $996,521 | $544,959 | $451,562 |
| 2020 | $10,286 | $937,035 | $509,810 | $427,225 |
| 2019 | $10,438 | $936,354 | $510,429 | $425,925 |
| 2018 | $17,206 | $1,575,391 | $1,266,674 | $308,717 |
| 2017 | $16,891 | $1,544,502 | $1,241,838 | $302,664 |
| 2016 | $16,369 | $1,514,219 | $1,217,489 | $296,730 |
| 2015 | $14,503 | $1,338,804 | $1,199,202 | $139,602 |
| 2014 | $14,148 | $1,368,887 | $1,274,120 | $94,767 |
Source: Public Records
Map
Nearby Homes
- 747 Orange Ave Unit 304
- 747 Orange Ave Unit 302
- 747 Orange Ave Unit 303
- 747 Orange Ave Unit 301
- 855 C Ave
- 861 B Ave
- 713 D Ave Unit 19
- 868 A Ave
- 835 D Ave Unit 5
- 835 D Ave Unit 4
- 660 Margarita Ave
- 1010 5th St
- 835 E Ave Unit B
- 969 Adella Ave
- 911 9th St
- 933 D Ave
- 440 Pomona Ave
- 848 E Ave Unit L2
- 832 San Luis Rey Ave
- 1533 10th St
Your Personal Tour Guide
Ask me questions while you tour the home.