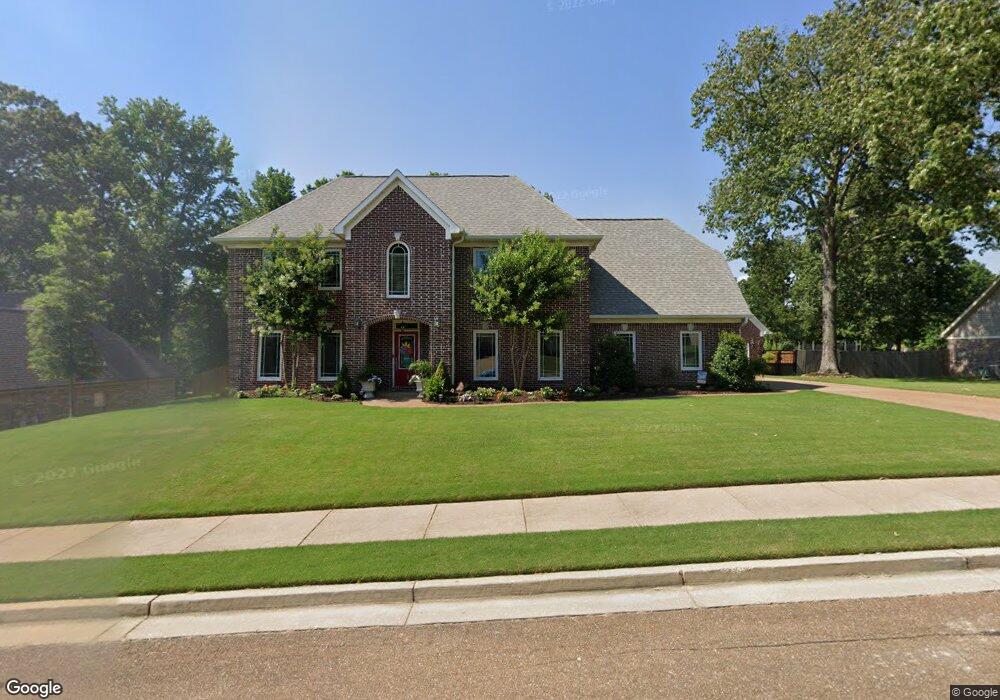
726 Bending Oak S Hernando, MS 38632
Estimated Value: $338,000 - $442,441
5
Beds
4
Baths
2,887
Sq Ft
$140/Sq Ft
Est. Value
About This Home
This home is located at 726 Bending Oak S, Hernando, MS 38632 and is currently estimated at $403,360, approximately $139 per square foot. 726 Bending Oak S is a home located in DeSoto County with nearby schools including Oak Grove Central Elementary School, Hernando Hills Elementary, and Hernando Elementary School.
Ownership History
Date
Name
Owned For
Owner Type
Purchase Details
Closed on
Nov 15, 2023
Sold by
Peterson William Matthew and Peterson Beverly G
Bought by
Peterson Revocable Living Trust and Peterson
Current Estimated Value
Purchase Details
Closed on
Feb 26, 2008
Sold by
Landers Richard A and Landers Candace M
Bought by
Winter Kevin S and Winter Haley B
Home Financials for this Owner
Home Financials are based on the most recent Mortgage that was taken out on this home.
Original Mortgage
$249,500
Interest Rate
5.97%
Mortgage Type
Purchase Money Mortgage
Purchase Details
Closed on
Aug 31, 2005
Sold by
B & S Homes Llc
Bought by
Landers Richard A and Landers Candance M
Create a Home Valuation Report for This Property
The Home Valuation Report is an in-depth analysis detailing your home's value as well as a comparison with similar homes in the area
Home Values in the Area
Average Home Value in this Area
Purchase History
| Date | Buyer | Sale Price | Title Company |
|---|---|---|---|
| Peterson Revocable Living Trust | -- | None Listed On Document | |
| Peterson William M | -- | None Listed On Document | |
| Winter Kevin S | -- | Select Title & Escrow Llc | |
| Landers Richard A | -- | None Available |
Source: Public Records
Mortgage History
| Date | Status | Borrower | Loan Amount |
|---|---|---|---|
| Previous Owner | Winter Kevin S | $249,500 |
Source: Public Records
Tax History
| Year | Tax Paid | Tax Assessment Tax Assessment Total Assessment is a certain percentage of the fair market value that is determined by local assessors to be the total taxable value of land and additions on the property. | Land | Improvement |
|---|---|---|---|---|
| 2025 | $3,028 | $28,570 | $3,500 | $25,070 |
| 2024 | $2,522 | $20,338 | $3,500 | $16,838 |
| 2023 | $2,522 | $20,338 | $0 | $0 |
| 2022 | $2,328 | $18,941 | $3,500 | $15,441 |
| 2021 | $2,328 | $18,941 | $3,500 | $15,441 |
| 2020 | $2,153 | $17,677 | $3,500 | $14,177 |
| 2019 | $2,153 | $17,677 | $3,500 | $14,177 |
| 2017 | $2,264 | $33,266 | $18,383 | $14,883 |
| 2016 | $2,156 | $18,383 | $3,500 | $14,883 |
| 2015 | $2,456 | $33,266 | $18,383 | $14,883 |
| 2014 | $2,098 | $18,383 | $0 | $0 |
| 2013 | $2,154 | $18,383 | $0 | $0 |
Source: Public Records
Map
Nearby Homes
- 5267 Reserve Way
- 3066 Meadows Way
- 1428 Brayden Ln
- 1254 Creekside Ln
- 665 Cedar Grove Cove
- 604 Rowan Oak Place
- 925 Cedar Grove Pkwy
- 1567 Eden Loop
- 833 Martin Cir N
- 990 Eagle Ridge Cove
- 445 Augusta Dr
- 1070 Green T Lake W
- 1679 Sandpiper Cove N
- 1795 Single Tree Dr
- 1215 Courtlynn Dr
- 208 Elkwood Ln
- 1245 Courtlynn Dr
- 1265 Courtlynn Dr
- 1123 Tara Dr
- 723 Fairway Trail
- 706 Bending Oak S
- 750 Bending Oak S
- 729 Bending Oak Cove
- 707 Bending Oak Cove
- 747 Bending Oak Cove
- 684 Bending Oak S
- 733 Bending Oak S
- 106 W Bending Oak Cove
- 117 S Bending Oak Rd
- 751 Bending Oak S
- 703 Bending Oak S
- 1408 Bending Oak E
- 124 Bending Oak Cove
- 120 Bending Oak Cove
- 1384 Bending Oak E
- 1426 Bending Oak E
- 1448 Bending Oak E
- 773 Bending Oak S
- 728 Bending Oak Cove
- 116 Bending Oak
Your Personal Tour Guide
Ask me questions while you tour the home.