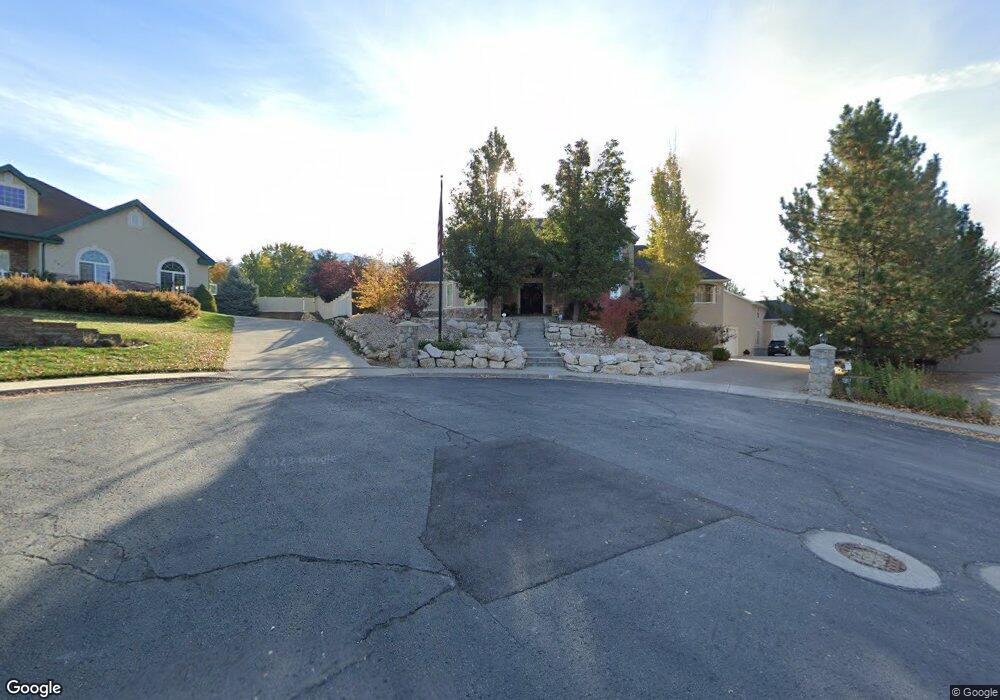
726 E 175 N Lindon, UT 84042
Estimated Value: $1,665,000 - $1,933,628
4
Beds
6
Baths
5,014
Sq Ft
$359/Sq Ft
Est. Value
About This Home
This home is located at 726 E 175 N, Lindon, UT 84042 and is currently estimated at $1,799,314, approximately $358 per square foot. 726 E 175 N is a home located in Utah County with nearby schools including Rocky Mountain Elementary, Oak Canyon Junior High School, and Pleasant Grove High School.
Ownership History
Date
Name
Owned For
Owner Type
Purchase Details
Closed on
Oct 18, 2001
Sold by
Christiansen Craig Alan
Bought by
Christiansen Craig Alan and Christiansen Karine
Current Estimated Value
Home Financials for this Owner
Home Financials are based on the most recent Mortgage that was taken out on this home.
Original Mortgage
$607,500
Outstanding Balance
$237,450
Interest Rate
6.87%
Estimated Equity
$1,561,864
Purchase Details
Closed on
Oct 15, 2001
Sold by
Christiansen Craig Alan and Christiansen Karine
Bought by
Christiansen Craig Alan
Home Financials for this Owner
Home Financials are based on the most recent Mortgage that was taken out on this home.
Original Mortgage
$607,500
Outstanding Balance
$237,450
Interest Rate
6.87%
Estimated Equity
$1,561,864
Purchase Details
Closed on
Feb 29, 2000
Sold by
Christiansen Craig Alan
Bought by
Christiansen Craig Alan and Christiansen Karine
Purchase Details
Closed on
Feb 8, 2000
Sold by
Christiansen Craig Alan and Christiansen Karine
Bought by
Christiansen Craig Alan
Purchase Details
Closed on
Jun 11, 1999
Sold by
Roberts Dan B
Bought by
Christiansen Craig Alan and Christiansen Karine
Create a Home Valuation Report for This Property
The Home Valuation Report is an in-depth analysis detailing your home's value as well as a comparison with similar homes in the area
Home Values in the Area
Average Home Value in this Area
Purchase History
| Date | Buyer | Sale Price | Title Company |
|---|---|---|---|
| Christiansen Craig Alan | -- | Associated Title Company | |
| Christiansen Craig Alan | -- | Associated Title Company | |
| Christiansen Craig Alan | -- | First American Title Co | |
| Christiansen Craig Alan | -- | First American Title Co | |
| Christiansen Craig Alan | -- | Old Republic Title Company |
Source: Public Records
Mortgage History
| Date | Status | Borrower | Loan Amount |
|---|---|---|---|
| Open | Christiansen Craig Alan | $607,500 |
Source: Public Records
Tax History
| Year | Tax Paid | Tax Assessment Tax Assessment Total Assessment is a certain percentage of the fair market value that is determined by local assessors to be the total taxable value of land and additions on the property. | Land | Improvement |
|---|---|---|---|---|
| 2025 | $6,213 | $892,815 | -- | -- |
| 2024 | $6,213 | $765,875 | $0 | $0 |
| 2023 | $5,757 | $762,300 | $0 | $0 |
| 2022 | $5,530 | $707,355 | $0 | $0 |
| 2021 | $5,221 | $1,007,000 | $319,700 | $687,300 |
| 2020 | $4,884 | $927,300 | $266,400 | $660,900 |
| 2019 | $4,148 | $821,600 | $266,400 | $555,200 |
| 2018 | $4,325 | $807,600 | $252,400 | $555,200 |
| 2017 | $4,246 | $425,150 | $0 | $0 |
| 2016 | $4,402 | $407,715 | $0 | $0 |
| 2015 | $4,124 | $361,130 | $0 | $0 |
| 2014 | -- | $314,985 | $0 | $0 |
Source: Public Records
Map
Nearby Homes
Your Personal Tour Guide
Ask me questions while you tour the home.