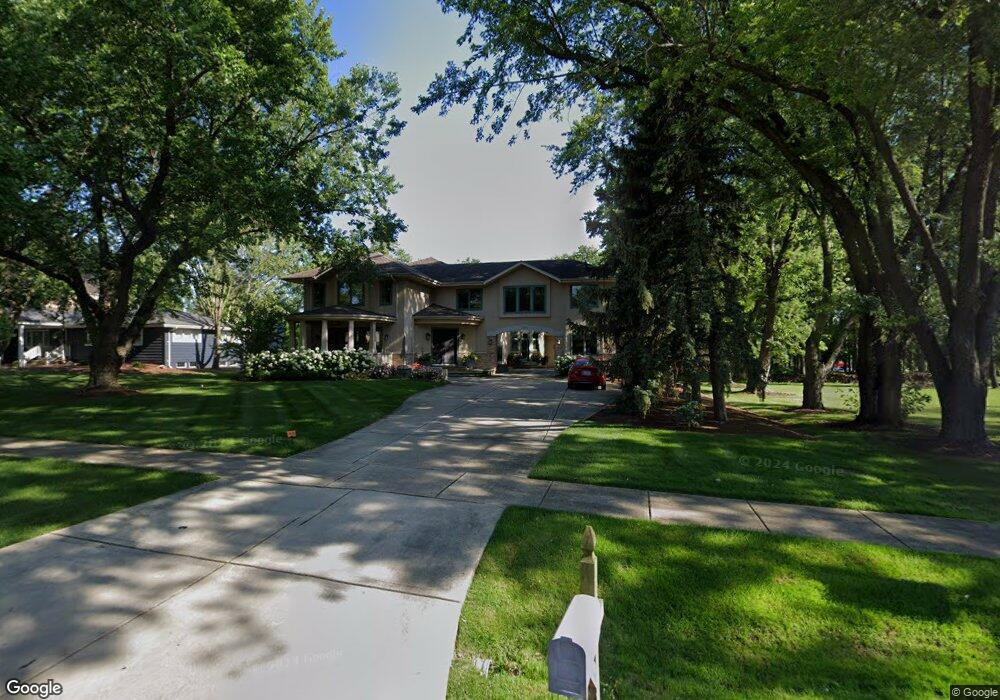
726 E Bauer Rd Naperville, IL 60563
North Naperville NeighborhoodEstimated Value: $1,351,000 - $2,025,000
Studio
1
Bath
5,291
Sq Ft
$310/Sq Ft
Est. Value
About This Home
This home is located at 726 E Bauer Rd, Naperville, IL 60563 and is currently estimated at $1,637,742, approximately $309 per square foot. 726 E Bauer Rd is a home located in DuPage County with nearby schools including Beebe Elementary School, Jefferson Jr High School, and Naperville North High School.
Ownership History
Date
Name
Owned For
Owner Type
Purchase Details
Closed on
Feb 7, 2003
Sold by
Pitzer Randolph L
Bought by
Pitzer Randolph L and Wolfkiel Julie A
Current Estimated Value
Home Financials for this Owner
Home Financials are based on the most recent Mortgage that was taken out on this home.
Original Mortgage
$256,000
Outstanding Balance
$110,517
Interest Rate
6.06%
Estimated Equity
$1,527,225
Purchase Details
Closed on
Apr 9, 1998
Sold by
Rocca Michael V
Bought by
Pitzer Randolph L
Home Financials for this Owner
Home Financials are based on the most recent Mortgage that was taken out on this home.
Original Mortgage
$187,650
Interest Rate
6.75%
Purchase Details
Closed on
Jul 15, 1994
Sold by
Isfort Christopher G and Isfort Lisa M
Bought by
Rocca Michael
Home Financials for this Owner
Home Financials are based on the most recent Mortgage that was taken out on this home.
Original Mortgage
$164,700
Interest Rate
6.5%
Create a Home Valuation Report for This Property
The Home Valuation Report is an in-depth analysis detailing your home's value as well as a comparison with similar homes in the area
Home Values in the Area
Average Home Value in this Area
Purchase History
| Date | Buyer | Sale Price | Title Company |
|---|---|---|---|
| Pitzer Randolph L | -- | -- | |
| Pitzer Randolph L | $208,500 | Attorneys Title Guaranty Fun | |
| Rocca Michael | $183,000 | -- |
Source: Public Records
Mortgage History
| Date | Status | Borrower | Loan Amount |
|---|---|---|---|
| Open | Pitzer Randolph L | $256,000 | |
| Previous Owner | Pitzer Randolph L | $187,650 | |
| Previous Owner | Rocca Michael | $164,700 |
Source: Public Records
Tax History
| Year | Tax Paid | Tax Assessment Tax Assessment Total Assessment is a certain percentage of the fair market value that is determined by local assessors to be the total taxable value of land and additions on the property. | Land | Improvement |
|---|---|---|---|---|
| 2024 | $29,828 | $494,895 | $107,510 | $387,385 |
| 2023 | $28,829 | $451,670 | $98,120 | $353,550 |
| 2022 | $27,282 | $427,550 | $92,880 | $334,670 |
| 2021 | $26,313 | $411,380 | $89,370 | $322,010 |
| 2020 | $25,765 | $403,980 | $87,760 | $316,220 |
| 2019 | $25,045 | $386,500 | $83,960 | $302,540 |
| 2018 | $25,052 | $386,500 | $83,960 | $302,540 |
| 2017 | $24,573 | $373,470 | $81,130 | $292,340 |
| 2016 | $25,030 | $373,470 | $81,130 | $292,340 |
| 2015 | $24,920 | $351,700 | $76,400 | $275,300 |
| 2014 | $25,732 | $351,700 | $76,400 | $275,300 |
| 2013 | $25,342 | $352,540 | $76,580 | $275,960 |
Source: Public Records
Map
Nearby Homes
- 26W250 Case St
- 5S365 Vest Ave
- 1437 N Charles Ave
- 1557 Chickasaw Dr
- 1221 N Loomis St
- 1112 Iroquois Ave Unit 12
- 930 N Loomis St
- 839 Mt Vernon Ct
- 837 N Loomis St
- 818 Fairwinds Ct
- 1111 Samstag Ct
- 5S345 Naperville Wheaton Rd
- 5S300 Tuthill Rd
- 1310 Eagle St
- 1314 N Eagle St
- 719 N Brainard St
- 717 N Brainard St
- 715 N Brainard St
- 27W141 48th St
- 5S583 Tuthill Rd
- 730 E Bauer Rd
- 5S351 Columbia St
- 5S350 Sherman Ave
- 725 E Bauer Rd
- 5S365 Columbia St
- 721 E Bauer Rd
- 5S380 Sherman Ave
- 713 E Bauer Rd
- 717 E Bauer Rd
- 729 E Bauer Rd
- 709 E Bauer Rd
- 2 Burlington Ave
- 733 E Bauer Rd
- 5S381 Columbia St
- 26W175 Bauer Rd
- 26W175 Bauer Rd
- 1504 N Columbia St
- 737 E Bauer Rd
- 5S428 Sherman Ave
- 804 Pawnee Ln