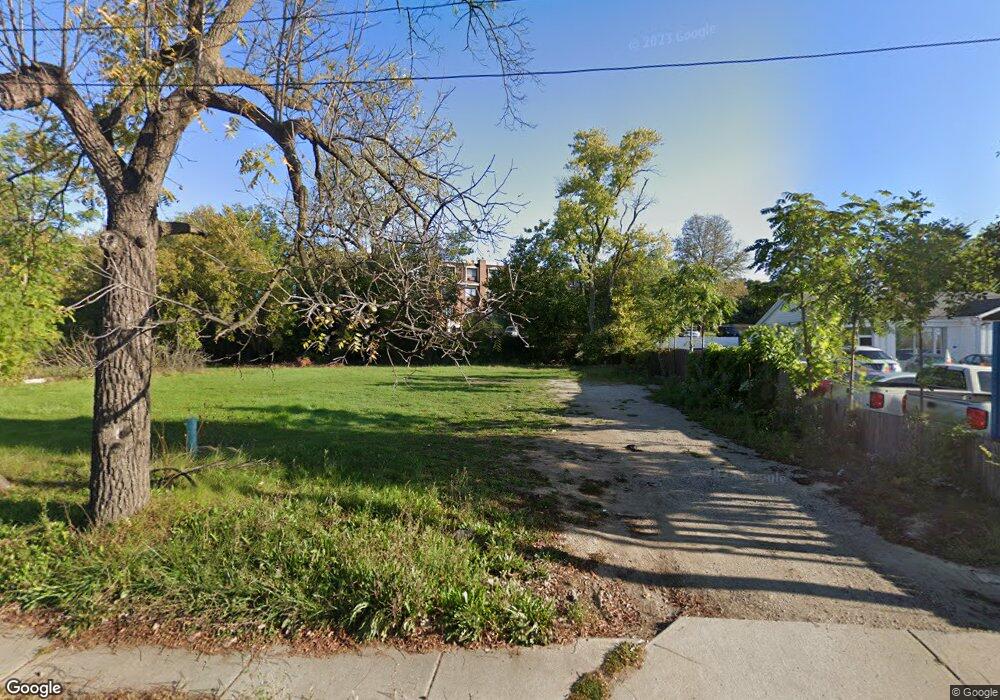
726 E Chicago St Elgin, IL 60120
Bluff City NeighborhoodEstimated Value: $283,000 - $339,000
3
Beds
1
Bath
1,372
Sq Ft
$228/Sq Ft
Est. Value
About This Home
This home is located at 726 E Chicago St, Elgin, IL 60120 and is currently estimated at $313,488, approximately $228 per square foot. 726 E Chicago St is a home located in Cook County with nearby schools including Lords Park Elementary School, Ellis Middle School, and Elgin High School.
Ownership History
Date
Name
Owned For
Owner Type
Purchase Details
Closed on
Apr 20, 2007
Sold by
Tellado Jennipher M
Bought by
726 Chicago Llc
Current Estimated Value
Purchase Details
Closed on
Feb 20, 2007
Sold by
Corrales Josafat
Bought by
Tellado Jenipher M
Purchase Details
Closed on
Mar 15, 2002
Sold by
King Of Glory Evangelical Lutheran Churc
Bought by
Bennett Marc and Bennett Jamie A
Home Financials for this Owner
Home Financials are based on the most recent Mortgage that was taken out on this home.
Original Mortgage
$102,150
Interest Rate
6.93%
Purchase Details
Closed on
Mar 6, 2001
Sold by
Diehl Frances C
Bought by
King Glory Evangelical Lutheran Church
Purchase Details
Closed on
Dec 13, 1996
Sold by
Diehl Frances S and Diehl Richard
Bought by
Diehl Frances S and Frances S Diehl Declaration Of Trust
Purchase Details
Closed on
Dec 12, 1996
Sold by
Stumme Frances E
Bought by
Diehl Frances S
Create a Home Valuation Report for This Property
The Home Valuation Report is an in-depth analysis detailing your home's value as well as a comparison with similar homes in the area
Home Values in the Area
Average Home Value in this Area
Purchase History
| Date | Buyer | Sale Price | Title Company |
|---|---|---|---|
| 726 Chicago Llc | $220,000 | None Available | |
| Tellado Jenipher M | -- | Multiple | |
| Bennett Marc | -- | -- | |
| King Glory Evangelical Lutheran Church | -- | -- | |
| Diehl France S | -- | -- | |
| Diehl Frances S | -- | -- | |
| Diehl Frances S | -- | -- |
Source: Public Records
Mortgage History
| Date | Status | Borrower | Loan Amount |
|---|---|---|---|
| Previous Owner | Bennett Marc | $102,150 |
Source: Public Records
Tax History
| Year | Tax Paid | Tax Assessment Tax Assessment Total Assessment is a certain percentage of the fair market value that is determined by local assessors to be the total taxable value of land and additions on the property. | Land | Improvement |
|---|---|---|---|---|
| 2025 | $6,332 | $27,000 | $6,691 | $20,309 |
| 2024 | $6,332 | $22,000 | $10,036 | $11,964 |
| 2023 | $6,154 | $22,000 | $10,036 | $11,964 |
| 2022 | $6,154 | $22,000 | $10,036 | $11,964 |
| 2021 | $4,775 | $13,856 | $7,108 | $6,748 |
| 2020 | $4,745 | $13,856 | $7,108 | $6,748 |
| 2019 | $4,772 | $15,569 | $7,108 | $8,461 |
| 2018 | $4,766 | $14,029 | $6,272 | $7,757 |
| 2017 | $4,752 | $14,029 | $6,272 | $7,757 |
| 2016 | $4,338 | $13,612 | $6,272 | $7,340 |
| 2015 | $4,029 | $11,467 | $5,854 | $5,613 |
| 2014 | $4,345 | $12,769 | $5,854 | $6,915 |
| 2013 | $4,202 | $12,769 | $5,854 | $6,915 |
Source: Public Records
Map
Nearby Homes
- 833 Forest Ave
- 115 N Porter St
- 149 Highbury Dr
- 450 Villa St
- 335 Shiloh Ln
- 445 Lucile Ave
- 483 Barrett St
- 899 Carl Ave
- 689 Bent St
- 513 Cookane Ave
- 332-334 St Charles St
- 457 Arlington Ave
- 453 Addison St
- 330 Buckingham Cir Unit C
- 631 Bent St
- 286 Villa St
- 385 Woodview Cir Unit B
- 131 N Gifford St
- 277 Gifford Place
- 130 Stonehurst Dr
- 765 Terrace Ct Unit 304
- 765 Terrace Ct Unit 209
- 765 Terrace Ct Unit 206
- 765 Terrace Ct Unit 112
- 765 Terrace Ct Unit 108
- 765 Terrace Ct Unit 104
- 765 Terrace Ct Unit 103
- 765 Terrace Ct Unit 212
- 765 Terrace Ct Unit 107
- 765 Terrace Ct Unit 311
- 765 Terrace Ct Unit 101
- 765 Terrace Ct Unit 208
- 765 Terrace Ct Unit 102
- 765 Terrace Ct Unit 312
- 765 Terrace Ct Unit 307
- 765 Terrace Ct Unit 210
- 765 Terrace Ct Unit 306
- 765 Terrace Ct Unit 106
- 765 Terrace Ct Unit 207
- 765 Terrace Ct Unit 202
Your Personal Tour Guide
Ask me questions while you tour the home.