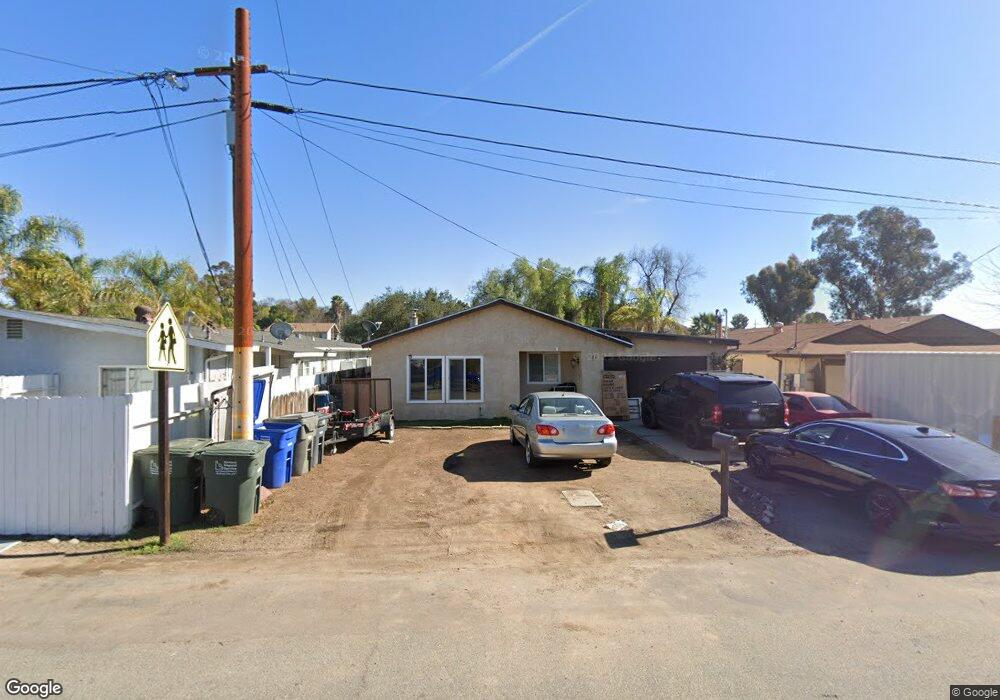
726 E St Ramona, CA 92065
Estimated Value: $636,000 - $750,000
4
Beds
2
Baths
1,323
Sq Ft
$510/Sq Ft
Est. Value
About This Home
This home is located at 726 E St, Ramona, CA 92065 and is currently estimated at $674,934, approximately $510 per square foot. 726 E St is a home located in San Diego County with nearby schools including Ramona Elementary School, Olive Peirce Middle School, and Ramona High School.
Ownership History
Date
Name
Owned For
Owner Type
Purchase Details
Closed on
Feb 17, 2022
Sold by
Medina Alejandro D
Bought by
Martinez Michell A Rivera and Medina Alejandro D
Current Estimated Value
Home Financials for this Owner
Home Financials are based on the most recent Mortgage that was taken out on this home.
Original Mortgage
$415,800
Outstanding Balance
$384,577
Interest Rate
3.69%
Mortgage Type
New Conventional
Estimated Equity
$290,357
Purchase Details
Closed on
Mar 29, 2019
Sold by
Martin Loyd Don and Martin Rosemary Ann
Bought by
Bastida Jacobo Jesus A and Rivera Martinez Yessenia
Home Financials for this Owner
Home Financials are based on the most recent Mortgage that was taken out on this home.
Original Mortgage
$422,211
Interest Rate
4.2%
Mortgage Type
FHA
Purchase Details
Closed on
Oct 25, 2016
Sold by
Don Martin Loyd
Bought by
Martin Loyd Don and Martin Rosemary Ann
Purchase Details
Closed on
Nov 1, 2006
Sold by
Solomon Penny Martin
Bought by
Martin Loyd Don
Purchase Details
Closed on
Apr 10, 1990
Purchase Details
Closed on
May 27, 1988
Create a Home Valuation Report for This Property
The Home Valuation Report is an in-depth analysis detailing your home's value as well as a comparison with similar homes in the area
Home Values in the Area
Average Home Value in this Area
Purchase History
| Date | Buyer | Sale Price | Title Company |
|---|---|---|---|
| Martinez Michell A Rivera | -- | First American Title | |
| Bastida Jacobo Jesus A | $430,000 | Fidelity National Title Co | |
| Martin Loyd Don | -- | None Available | |
| Martin Loyd Don | -- | None Available | |
| -- | $139,000 | -- | |
| -- | $104,000 | -- |
Source: Public Records
Mortgage History
| Date | Status | Borrower | Loan Amount |
|---|---|---|---|
| Open | Martinez Michell A Rivera | $415,800 | |
| Previous Owner | Bastida Jacobo Jesus A | $422,211 |
Source: Public Records
Tax History
| Year | Tax Paid | Tax Assessment Tax Assessment Total Assessment is a certain percentage of the fair market value that is determined by local assessors to be the total taxable value of land and additions on the property. | Land | Improvement |
|---|---|---|---|---|
| 2025 | $6,203 | $479,669 | $245,412 | $234,257 |
| 2024 | $6,203 | $470,264 | $240,600 | $229,664 |
| 2023 | $5,718 | $461,044 | $235,883 | $225,161 |
| 2022 | $5,833 | $452,005 | $231,258 | $220,747 |
| 2021 | $5,751 | $443,143 | $226,724 | $216,419 |
| 2020 | $5,704 | $438,600 | $224,400 | $214,200 |
| 2019 | $3,382 | $229,215 | $98,938 | $130,277 |
| 2018 | $3,299 | $224,722 | $96,999 | $127,723 |
| 2017 | $3,252 | $220,317 | $95,098 | $125,219 |
| 2016 | $3,173 | $215,998 | $93,234 | $122,764 |
| 2015 | $3,090 | $212,754 | $91,834 | $120,920 |
| 2014 | $2,997 | $208,588 | $90,036 | $118,552 |
Source: Public Records
Map
Nearby Homes
Your Personal Tour Guide
Ask me questions while you tour the home.