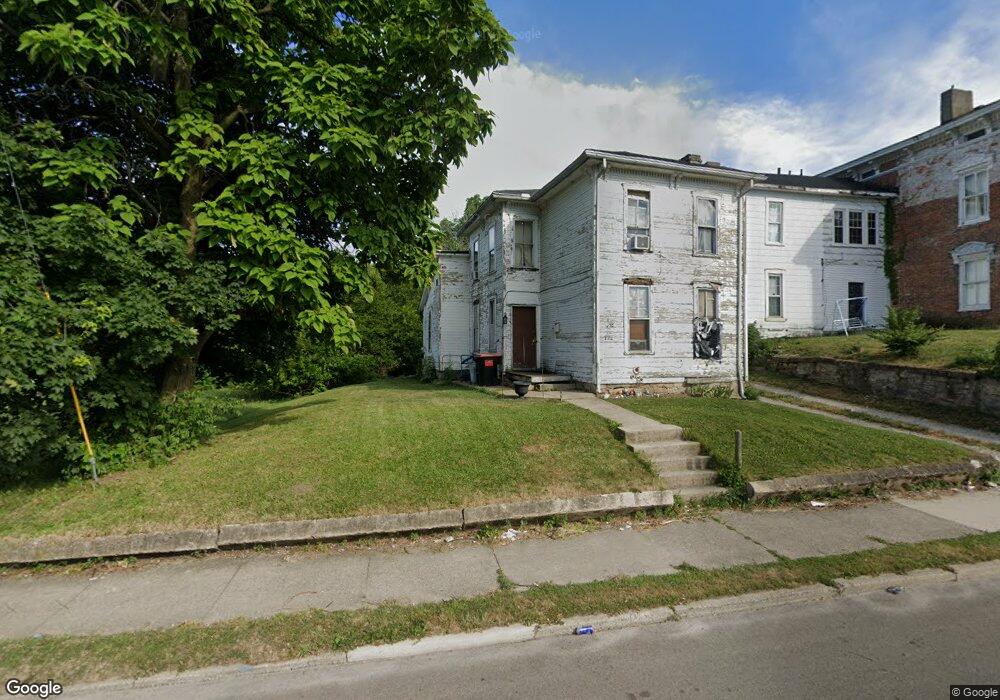
726 East St Springfield, OH 45505
Estimated Value: $61,847 - $147,000
4
Beds
1
Bath
1,384
Sq Ft
$63/Sq Ft
Est. Value
About This Home
This home is located at 726 East St, Springfield, OH 45505 and is currently estimated at $87,462, approximately $63 per square foot. 726 East St is a home located in Clark County with nearby schools including Kenwood Elementary School, Schaefer Middle School, and Springfield High School.
Ownership History
Date
Name
Owned For
Owner Type
Purchase Details
Closed on
Mar 28, 2024
Sold by
Graham James Clayton and Graham Clifftina
Bought by
Tierra Mia Investments Llc
Current Estimated Value
Home Financials for this Owner
Home Financials are based on the most recent Mortgage that was taken out on this home.
Original Mortgage
$108,850
Interest Rate
7.17%
Mortgage Type
Construction
Purchase Details
Closed on
Dec 14, 2020
Sold by
Mcdonough John P and Mcdonough Elizabeth
Bought by
Mcdonough Mark and Graham James Clayton
Purchase Details
Closed on
Jan 1, 1981
Sold by
Beckel Arthur C and Beckel Elizabeth A
Bought by
Mcdonough John P and Mcdonough Garnett L
Create a Home Valuation Report for This Property
The Home Valuation Report is an in-depth analysis detailing your home's value as well as a comparison with similar homes in the area
Home Values in the Area
Average Home Value in this Area
Purchase History
| Date | Buyer | Sale Price | Title Company |
|---|---|---|---|
| Tierra Mia Investments Llc | $59,000 | None Listed On Document | |
| Mcdonough Mark | -- | None Available | |
| Mcdonough John P | $2,400 | -- |
Source: Public Records
Mortgage History
| Date | Status | Borrower | Loan Amount |
|---|---|---|---|
| Previous Owner | Tierra Mia Investments Llc | $108,850 |
Source: Public Records
Tax History
| Year | Tax Paid | Tax Assessment Tax Assessment Total Assessment is a certain percentage of the fair market value that is determined by local assessors to be the total taxable value of land and additions on the property. | Land | Improvement |
|---|---|---|---|---|
| 2025 | $504 | $14,560 | $3,200 | $11,360 |
| 2024 | $492 | $9,950 | $2,510 | $7,440 |
| 2023 | $492 | $9,950 | $2,510 | $7,440 |
| 2022 | $504 | $9,950 | $2,510 | $7,440 |
| 2021 | $497 | $9,050 | $2,290 | $6,760 |
| 2020 | $498 | $9,050 | $2,290 | $6,760 |
| 2019 | $500 | $9,050 | $2,290 | $6,760 |
| 2018 | $441 | $7,660 | $1,900 | $5,760 |
| 2017 | $440 | $7,669 | $1,904 | $5,765 |
| 2016 | $441 | $7,669 | $1,904 | $5,765 |
| 2015 | $450 | $7,669 | $1,904 | $5,765 |
| 2014 | $448 | $7,669 | $1,904 | $5,765 |
| 2013 | $221 | $7,669 | $1,904 | $5,765 |
Source: Public Records
Map
Nearby Homes
- 920 Elder St
- 920 Oak St
- 453 E Pleasant St
- 705 York St
- 1008 Tibbetts Ave
- 652 E Southern Ave
- 1111 Lafayette Ave
- 625 Tibbetts Ave
- 908 Pine St
- 441 E Euclid Ave
- 1247 Selma Rd
- 1213 Gable St
- 550 E Rose St
- 418 Linden Ave
- 360 S Greenmount Ave
- 1215 E High St
- 638 Clifton Ave
- 1519 Tibbetts Ave
- 1440 Selma Rd
- 205 E Grand Ave
Your Personal Tour Guide
Ask me questions while you tour the home.