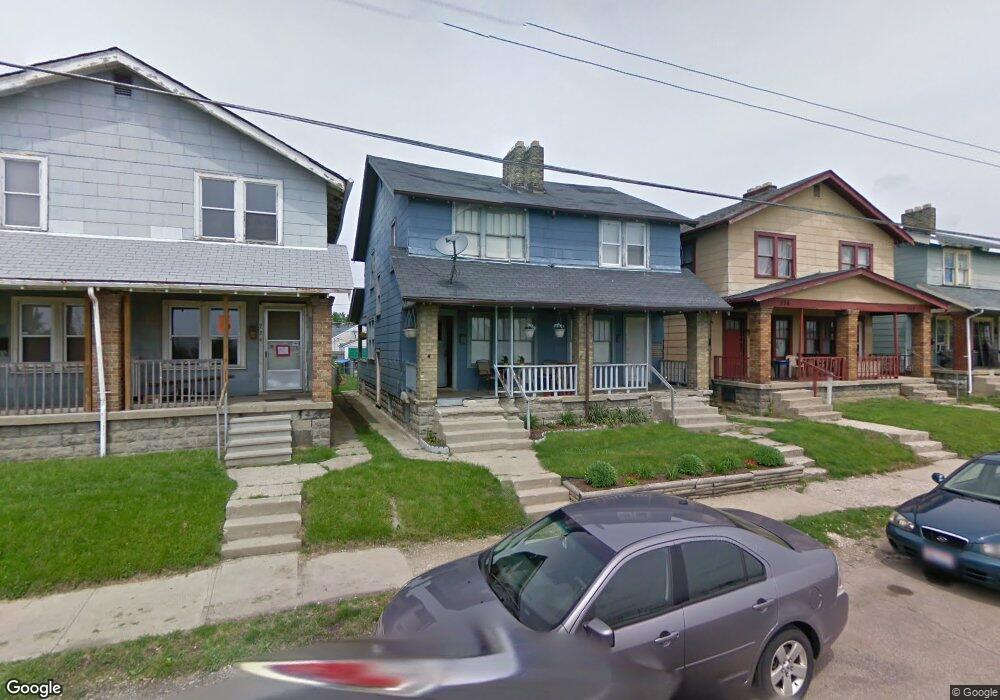
726 Frebis Ave Unit 728 Columbus, OH 43206
Karns Park NeighborhoodEstimated Value: $257,000 - $291,000
2
Beds
1
Bath
858
Sq Ft
$316/Sq Ft
Est. Value
About This Home
This home is located at 726 Frebis Ave Unit 728, Columbus, OH 43206 and is currently estimated at $270,849, approximately $315 per square foot. 726 Frebis Ave Unit 728 is a home located in Franklin County with nearby schools including Lincoln Park Elementary School, South High School, and St Pauls Lutheran School.
Ownership History
Date
Name
Owned For
Owner Type
Purchase Details
Closed on
Oct 25, 2019
Sold by
Cbus Home Co Llc
Bought by
Nosky Investments Llc
Current Estimated Value
Home Financials for this Owner
Home Financials are based on the most recent Mortgage that was taken out on this home.
Original Mortgage
$118,983
Interest Rate
3.6%
Mortgage Type
Commercial
Purchase Details
Closed on
Feb 16, 2001
Sold by
Schilling John
Bought by
Surtis Delbert
Home Financials for this Owner
Home Financials are based on the most recent Mortgage that was taken out on this home.
Original Mortgage
$29,000
Interest Rate
7.1%
Mortgage Type
Seller Take Back
Purchase Details
Closed on
Aug 19, 1982
Bought by
Schilling John L
Purchase Details
Closed on
Aug 1, 1979
Create a Home Valuation Report for This Property
The Home Valuation Report is an in-depth analysis detailing your home's value as well as a comparison with similar homes in the area
Home Values in the Area
Average Home Value in this Area
Purchase History
| Date | Buyer | Sale Price | Title Company |
|---|---|---|---|
| Nosky Investments Llc | $95,000 | Pm Title Box | |
| Cbus Home Co Llc | $75,000 | Pm Title Box | |
| Surtis Delbert | $38,000 | -- | |
| Schilling John L | -- | -- | |
| -- | $10,000 | -- |
Source: Public Records
Mortgage History
| Date | Status | Borrower | Loan Amount |
|---|---|---|---|
| Closed | Nosky Investments Llc | $118,983 | |
| Previous Owner | Surtis Delbert | $29,000 |
Source: Public Records
Tax History Compared to Growth
Tax History
| Year | Tax Paid | Tax Assessment Tax Assessment Total Assessment is a certain percentage of the fair market value that is determined by local assessors to be the total taxable value of land and additions on the property. | Land | Improvement |
|---|---|---|---|---|
| 2024 | $7,296 | $74,310 | $20,720 | $53,590 |
| 2023 | $3,685 | $74,305 | $20,720 | $53,585 |
| 2022 | $1,326 | $20,970 | $4,620 | $16,350 |
| 2021 | $1,444 | $20,970 | $4,620 | $16,350 |
| 2020 | $1,330 | $20,970 | $4,620 | $16,350 |
| 2019 | $1,298 | $17,470 | $3,850 | $13,620 |
| 2018 | $1,056 | $17,470 | $3,850 | $13,620 |
| 2017 | $1,203 | $17,470 | $3,850 | $13,620 |
| 2016 | $1,108 | $13,200 | $3,610 | $9,590 |
| 2015 | $816 | $13,200 | $3,610 | $9,590 |
| 2014 | $818 | $13,200 | $3,610 | $9,590 |
| 2013 | $424 | $13,860 | $3,780 | $10,080 |
Source: Public Records
Map
Nearby Homes
- 706 Frebis Ave
- 721 Hanford St Unit 721-723
- 676 E Moler St
- 656 Sheldon Ave
- 0 Gilbert St
- 621-627 E Gates St
- 609 Frebis Ave
- 735-737 E Mithoff St
- 605 Frebis Ave
- 601 Frebis Ave
- 1263 Heyl Ave
- 798 E Mithoff St
- 739 Thurman Ave
- 650 E Mithoff St
- 554 Hanford St
- 563 Frebis Ave
- 693 Thurman Ave
- 1404 S Ohio Ave
- 546 Frebis Ave
- 523 Hanford St
- 722 Frebis Ave Unit 724
- 730 Frebis Ave Unit 732
- 730 Frebis Ave Unit 2
- 728 Frebis Ave
- 722-724 Frebis Ave
- 734 Frebis Ave Unit 736
- 718 Frebis Ave Unit 720
- 714 Frebis Ave Unit 716
- 714 Frebis Ave Unit 2
- 727 Hanford St
- 721-723 Hanford St
- 721 Hanford St Unit 723
- 721 Hanford St
- 731 Hanford St
- 723 Hanford St
- 717-719 Hanford St
- 744 Frebis Ave
- 717 Hanford St Unit 719
- 742 Frebis Ave
- 742-744 Frebis Ave