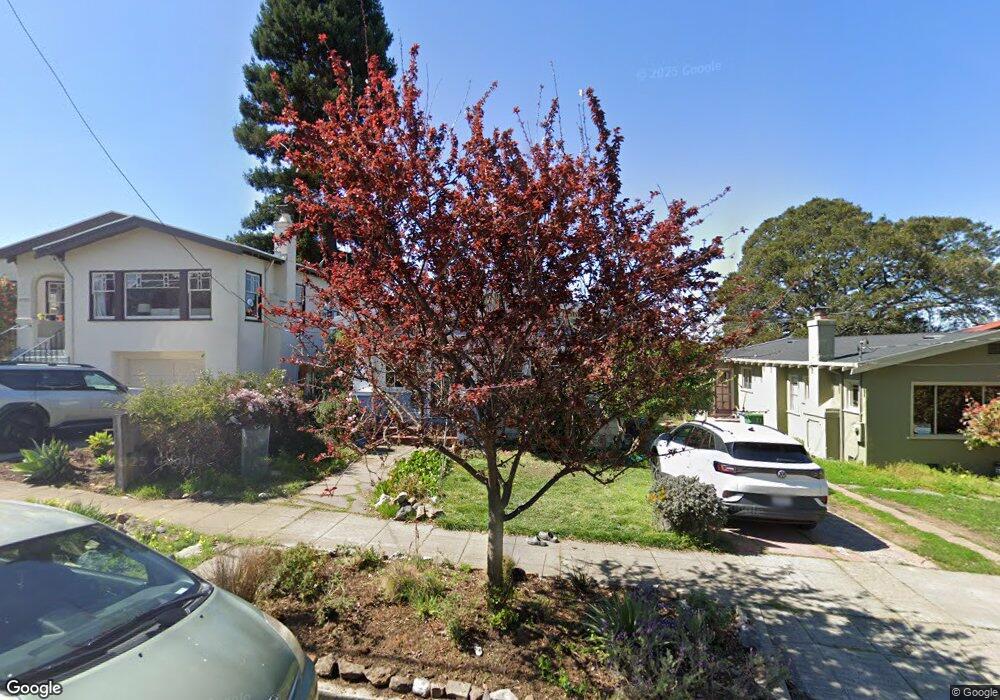
726 Neilson St Berkeley, CA 94707
Thousand Oaks NeighborhoodEstimated Value: $1,145,177 - $1,443,000
2
Beds
1
Bath
925
Sq Ft
$1,450/Sq Ft
Est. Value
About This Home
This home is located at 726 Neilson St, Berkeley, CA 94707 and is currently estimated at $1,341,544, approximately $1,450 per square foot. 726 Neilson St is a home located in Alameda County with nearby schools including Thousand Oaks Elementary School, Ruth Acty Elementary, and Berkeley Arts Magnet at Whittier School.
Ownership History
Date
Name
Owned For
Owner Type
Purchase Details
Closed on
Jun 20, 2025
Sold by
Beach Benjamin and Faer Laura
Bought by
Beach Faer 2025 Family Trust and Beach
Current Estimated Value
Purchase Details
Closed on
Dec 13, 2010
Sold by
Rhodes Lynn Nell
Bought by
Faer Laura and Beach Benjamin
Home Financials for this Owner
Home Financials are based on the most recent Mortgage that was taken out on this home.
Original Mortgage
$370,000
Interest Rate
4.21%
Mortgage Type
New Conventional
Create a Home Valuation Report for This Property
The Home Valuation Report is an in-depth analysis detailing your home's value as well as a comparison with similar homes in the area
Home Values in the Area
Average Home Value in this Area
Purchase History
| Date | Buyer | Sale Price | Title Company |
|---|---|---|---|
| Beach Faer 2025 Family Trust | -- | None Listed On Document | |
| Faer Laura | $570,000 | Chicago Title Company |
Source: Public Records
Mortgage History
| Date | Status | Borrower | Loan Amount |
|---|---|---|---|
| Previous Owner | Faer Laura | $370,000 |
Source: Public Records
Tax History
| Year | Tax Paid | Tax Assessment Tax Assessment Total Assessment is a certain percentage of the fair market value that is determined by local assessors to be the total taxable value of land and additions on the property. | Land | Improvement |
|---|---|---|---|---|
| 2025 | $10,484 | $723,226 | $219,068 | $511,158 |
| 2024 | $10,484 | $708,914 | $214,774 | $501,140 |
| 2023 | $10,271 | $701,880 | $210,564 | $491,316 |
| 2022 | $10,103 | $681,120 | $206,436 | $481,684 |
| 2021 | $10,134 | $667,628 | $202,388 | $472,240 |
| 2020 | $9,643 | $667,714 | $200,314 | $467,400 |
| 2019 | $9,319 | $654,627 | $196,388 | $458,239 |
| 2018 | $9,172 | $641,797 | $192,539 | $449,258 |
| 2017 | $8,840 | $629,217 | $188,765 | $440,452 |
| 2016 | $8,591 | $616,881 | $185,064 | $431,817 |
| 2015 | $8,481 | $607,620 | $182,286 | $425,334 |
| 2014 | $8,436 | $595,717 | $178,715 | $417,002 |
Source: Public Records
Map
Nearby Homes
- 1563 Thousand Oaks Blvd
- 720 Key Route Blvd
- 1266 Washington Ave
- 820 Key Route Blvd
- 840 Key Route Blvd
- 1259 Portland Ave
- 938 Masonic Ave
- 606 Masonic Ave
- 1038 Pomona Ave
- 1150 Washington Ave
- 417 Evelyn Ave Unit 205
- 1983 Yosemite Rd
- 728 Stannage Ave
- 1066 Peralta Ave
- 946 Kains Ave
- 1127 Key Route Blvd
- 986 Kains Ave
- 305 Coronado St
- 589 San Luis Rd
- 846 Adams St
Your Personal Tour Guide
Ask me questions while you tour the home.