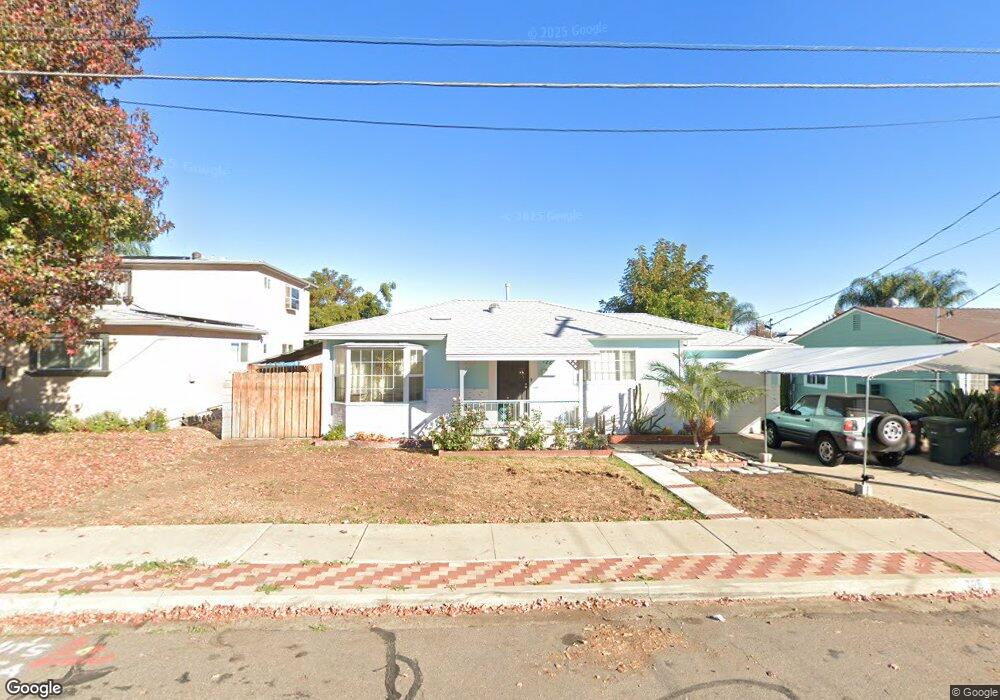
726 Palomar Ave El Cajon, CA 92020
Estimated Value: $651,482 - $735,000
2
Beds
1
Bath
816
Sq Ft
$839/Sq Ft
Est. Value
About This Home
This home is located at 726 Palomar Ave, El Cajon, CA 92020 and is currently estimated at $684,371, approximately $838 per square foot. 726 Palomar Ave is a home located in San Diego County with nearby schools including Chase Avenue Elementary School, Cajon Valley Middle School, and Bostonia Global High School.
Ownership History
Date
Name
Owned For
Owner Type
Purchase Details
Closed on
Nov 6, 2013
Sold by
Coverdale Grant Aaron
Bought by
Coverdale Grant Aaron and Coverdale Tina Wolfe
Current Estimated Value
Purchase Details
Closed on
Dec 26, 2001
Sold by
Coverdale Tina A
Bought by
Coverdale Grant Aaron
Home Financials for this Owner
Home Financials are based on the most recent Mortgage that was taken out on this home.
Original Mortgage
$208,972
Outstanding Balance
$81,293
Interest Rate
6.51%
Mortgage Type
VA
Estimated Equity
$603,078
Purchase Details
Closed on
Dec 3, 2001
Sold by
Coones John M
Bought by
Coverdale Grant Aaron
Home Financials for this Owner
Home Financials are based on the most recent Mortgage that was taken out on this home.
Original Mortgage
$208,972
Outstanding Balance
$81,293
Interest Rate
6.51%
Mortgage Type
VA
Estimated Equity
$603,078
Create a Home Valuation Report for This Property
The Home Valuation Report is an in-depth analysis detailing your home's value as well as a comparison with similar homes in the area
Home Values in the Area
Average Home Value in this Area
Purchase History
| Date | Buyer | Sale Price | Title Company |
|---|---|---|---|
| Coverdale Grant Aaron | -- | None Available | |
| Coverdale Grant Aaron | -- | Commonwealth Land Title Co | |
| Coverdale Grant Aaron | $205,500 | Commonwealth Land Title Co |
Source: Public Records
Mortgage History
| Date | Status | Borrower | Loan Amount |
|---|---|---|---|
| Open | Coverdale Grant Aaron | $208,972 |
Source: Public Records
Tax History Compared to Growth
Tax History
| Year | Tax Paid | Tax Assessment Tax Assessment Total Assessment is a certain percentage of the fair market value that is determined by local assessors to be the total taxable value of land and additions on the property. | Land | Improvement |
|---|---|---|---|---|
| 2025 | $4,503 | $310,061 | $162,491 | $147,570 |
| 2024 | $4,503 | $303,982 | $159,305 | $144,677 |
| 2023 | $4,310 | $298,023 | $156,182 | $141,841 |
| 2022 | $4,383 | $292,180 | $153,120 | $139,060 |
| 2021 | $4,085 | $286,452 | $150,118 | $136,334 |
| 2020 | $3,995 | $283,516 | $148,579 | $134,937 |
| 2019 | $3,333 | $277,958 | $145,666 | $132,292 |
| 2018 | $3,278 | $272,509 | $142,810 | $129,699 |
| 2017 | $3,234 | $267,166 | $140,010 | $127,156 |
| 2016 | $3,104 | $261,928 | $137,265 | $124,663 |
| 2015 | $3,087 | $257,995 | $135,204 | $122,791 |
| 2014 | $3,026 | $252,942 | $132,556 | $120,386 |
Source: Public Records
Map
Nearby Homes
- 730 W Chase Ave
- 1141 Emerald Ave Unit 11
- 1521 Kimberly Woods Dr
- 1198 Benjamin Place
- 1345 Hardin Dr
- 1110 Benjamin Place
- 1000 Estes St Unit 11
- 1440 S Orange Ave Unit 105
- 1440 S Orange Ave
- 1440 S Orange Ave Unit 92
- 1440 S Orange Ave Unit 64
- 1440 S Orange Ave Unit 99
- 1440 S Orange Ave Unit 71
- 1490 S Orange Ave Unit 117
- 1490 S Orange Ave Unit 123
- 908 S Sunshine Ave Unit 18
- 5030 Helix Terrace
- 10310 Fuerte Dr
- 9903 Shadow Rd
- 10164 Vivera Dr
- 714 Palomar Ave
- 738 Palomar Ave
- 725 Laguna Ave
- 737 Laguna Ave
- 713 Laguna Ave
- 702 Palomar Ave
- 750 Palomar Ave
- 701 Laguna Ave
- 749 Laguna Ave
- 725 Palomar Ave
- 713 Palomar Ave
- 737 Palomar Ave
- 698 Palomar Ave
- 762 Palomar Ave
- 701 Palomar Ave
- 761 Laguna Ave
- 697 Laguna Ave
- 749 Palomar Ave
- 699 Palomar Ave
- 686 Palomar Ave