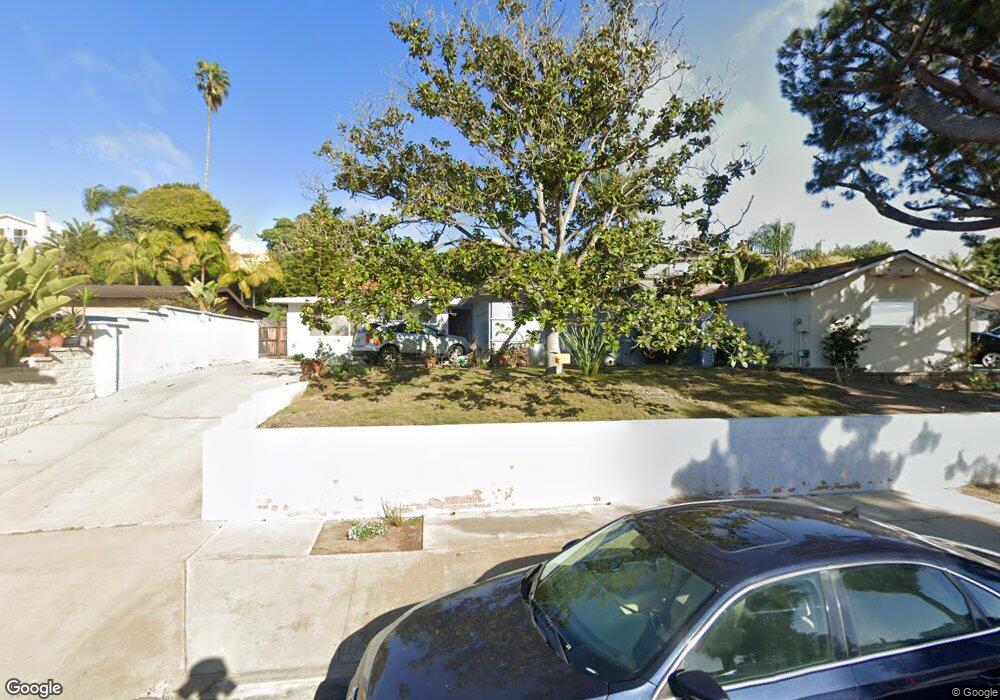
726 S Cedros Ave Solana Beach, CA 92075
Estimated Value: $1,967,901 - $3,967,000
3
Beds
2
Baths
1,350
Sq Ft
$1,943/Sq Ft
Est. Value
About This Home
This home is located at 726 S Cedros Ave, Solana Beach, CA 92075 and is currently estimated at $2,623,475, approximately $1,943 per square foot. 726 S Cedros Ave is a home located in San Diego County with nearby schools including Skyline Elementary School, Solana Vista Elementary School, and Earl Warren Middle School.
Ownership History
Date
Name
Owned For
Owner Type
Purchase Details
Closed on
Aug 6, 2020
Sold by
Minick Isabel M
Bought by
Minick Isabel M and The Marital Trust Of The John
Current Estimated Value
Home Financials for this Owner
Home Financials are based on the most recent Mortgage that was taken out on this home.
Original Mortgage
$435,000
Interest Rate
3%
Mortgage Type
New Conventional
Purchase Details
Closed on
Nov 18, 2011
Sold by
Minick Isabel M
Bought by
Minick Isabel M
Home Financials for this Owner
Home Financials are based on the most recent Mortgage that was taken out on this home.
Original Mortgage
$300,000
Interest Rate
3.35%
Mortgage Type
New Conventional
Purchase Details
Closed on
Sep 28, 1999
Sold by
Minick Isabel M Tr
Bought by
Minick Ysabel M
Purchase Details
Closed on
Oct 12, 1995
Sold by
Minick John D and Minick Isabel M
Bought by
Minick John D and Minick Isabel M
Home Financials for this Owner
Home Financials are based on the most recent Mortgage that was taken out on this home.
Original Mortgage
$221,000
Interest Rate
7.21%
Create a Home Valuation Report for This Property
The Home Valuation Report is an in-depth analysis detailing your home's value as well as a comparison with similar homes in the area
Home Values in the Area
Average Home Value in this Area
Purchase History
| Date | Buyer | Sale Price | Title Company |
|---|---|---|---|
| Minick Isabel M | -- | Stewart Title Of Ca Inc | |
| Minick Isabel M | -- | Stewart Title Of Ca Inc | |
| Minick Isabel M | -- | Fidelity Title | |
| Minick Isabel M | -- | Fidelity National Title Co | |
| Minick Ysabel M | -- | -- | |
| Minick John D | -- | -- | |
| Minick John D | -- | Old Republic Title Company |
Source: Public Records
Mortgage History
| Date | Status | Borrower | Loan Amount |
|---|---|---|---|
| Closed | Minick Isabel M | $435,000 | |
| Closed | Minick Isabel M | $300,000 | |
| Closed | Minick John D | $221,000 |
Source: Public Records
Tax History Compared to Growth
Tax History
| Year | Tax Paid | Tax Assessment Tax Assessment Total Assessment is a certain percentage of the fair market value that is determined by local assessors to be the total taxable value of land and additions on the property. | Land | Improvement |
|---|---|---|---|---|
| 2025 | $1,411 | $61,157 | $19,603 | $41,554 |
| 2024 | $1,411 | $59,959 | $19,219 | $40,740 |
| 2023 | $1,393 | $58,785 | $18,843 | $39,942 |
| 2022 | $1,380 | $57,633 | $18,474 | $39,159 |
| 2021 | $1,367 | $56,504 | $18,112 | $38,392 |
| 2020 | $1,361 | $55,926 | $17,927 | $37,999 |
| 2019 | $1,348 | $54,830 | $17,576 | $37,254 |
| 2018 | $1,318 | $53,756 | $17,232 | $36,524 |
| 2017 | $1,290 | $52,703 | $16,895 | $35,808 |
| 2016 | $1,239 | $51,670 | $16,564 | $35,106 |
| 2015 | $1,214 | $50,895 | $16,316 | $34,579 |
| 2014 | $1,189 | $49,899 | $15,997 | $33,902 |
Source: Public Records
Map
Nearby Homes
- 747 S Cedros Ave
- 876 Cofair Ct
- 834 S Cedros Ave
- 773 E Solana Cir
- 521 S Rios Ave
- 121 Via de la Valle
- 675 S Sierra Ave Unit 40
- 190 Del Mar Shores Terrace Unit 42
- 585 S Sierra Ave Unit 27
- 515 S Sierra Ave Unit 130
- Plan 4 at Drift
- Plan 3 at Drift
- Plan 5 at Drift
- Plan 2 at Drift
- Plan 1 at Drift
- 929 Border Ave
- 429 S Sierra Ave Unit 324
- 429 S Sierra Ave Unit 151
- 435 S Sierra Ave Unit 114
- 441 S Sierra Ave Unit 307
- 720 S Cedros Ave
- 730 S Cedros Ave
- 740 S Cedros Ave
- 716 S Cedros Ave
- 725 Marsolan Ave
- 731 Marsolan Ave
- 721 S Cedros Ave Unit 7
- 721 S Cedros Ave
- 737 Marsolan Ave
- 727 S Cedros Ave Unit 29
- 735 S Cedros Ave
- 710 S Cedros Ave
- 744 S Cedros Ave
- 711 Marsolan Ave
- 741 S Cedros Ave
- 743 Marsolan Ave
- 715 S Cedros Ave Unit 17
- 751 S Cedros Ave
- 707 Marsolan Ave
- 704 S Cedros Ave