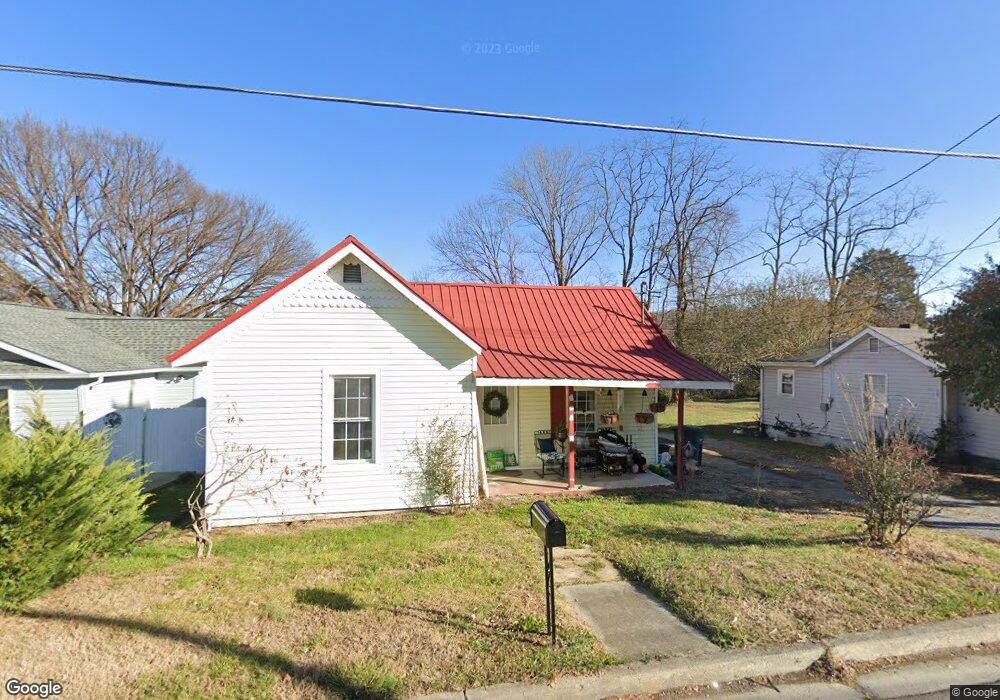
726 S Watauga Ave Elizabethton, TN 37643
Estimated Value: $59,000 - $178,000
2
Beds
1
Bath
1,132
Sq Ft
$106/Sq Ft
Est. Value
About This Home
This home is located at 726 S Watauga Ave, Elizabethton, TN 37643 and is currently estimated at $120,292, approximately $106 per square foot. 726 S Watauga Ave is a home with nearby schools including Elizabethton High School and East Tn Christian Home & Academy.
Ownership History
Date
Name
Owned For
Owner Type
Purchase Details
Closed on
Aug 16, 2023
Sold by
Koruschak Eric and Koruschak Krystal
Bought by
Stone Sheila Lee
Current Estimated Value
Home Financials for this Owner
Home Financials are based on the most recent Mortgage that was taken out on this home.
Original Mortgage
$85,500
Interest Rate
6.81%
Mortgage Type
New Conventional
Purchase Details
Closed on
Jun 12, 2023
Sold by
Royston Jerry L
Bought by
Koruschak Eric and Krystal Korsuchak
Purchase Details
Closed on
Jan 3, 2023
Sold by
Stone Sheila Lee
Bought by
Stone Sheila Lee and Fisher Amelia Kay
Purchase Details
Closed on
Feb 25, 2004
Sold by
Johnson Jerry
Bought by
Royston Jerry L
Purchase Details
Closed on
Jan 17, 1992
Bought by
Johnson Jerry
Purchase Details
Closed on
Sep 21, 1988
Bought by
Reece Darrell G
Purchase Details
Closed on
Aug 8, 1988
Bought by
Happy Valley Credit Union
Purchase Details
Closed on
Oct 14, 1986
Bought by
Hairston Ronnie and Hairston Carmelia
Create a Home Valuation Report for This Property
The Home Valuation Report is an in-depth analysis detailing your home's value as well as a comparison with similar homes in the area
Home Values in the Area
Average Home Value in this Area
Purchase History
| Date | Buyer | Sale Price | Title Company |
|---|---|---|---|
| Stone Sheila Lee | $90,000 | None Listed On Document | |
| Koruschak Eric | $44,000 | None Listed On Document | |
| Stone Sheila Lee | -- | None Listed On Document | |
| Royston Jerry L | $18,000 | -- | |
| Johnson Jerry | $42,400 | -- | |
| Reece Darrell G | $13,900 | -- | |
| Happy Valley Credit Union | -- | -- | |
| Hairston Ronnie | $13,900 | -- |
Source: Public Records
Mortgage History
| Date | Status | Borrower | Loan Amount |
|---|---|---|---|
| Previous Owner | Stone Sheila Lee | $85,500 |
Source: Public Records
Tax History Compared to Growth
Tax History
| Year | Tax Paid | Tax Assessment Tax Assessment Total Assessment is a certain percentage of the fair market value that is determined by local assessors to be the total taxable value of land and additions on the property. | Land | Improvement |
|---|---|---|---|---|
| 2024 | $598 | $18,100 | $5,575 | $12,525 |
| 2023 | $598 | $18,100 | $0 | $0 |
| 2022 | $651 | $18,100 | $5,575 | $12,525 |
| 2021 | $367 | $18,100 | $5,575 | $12,525 |
| 2020 | $434 | $18,100 | $5,575 | $12,525 |
| 2019 | $434 | $10,050 | $2,300 | $7,750 |
| 2018 | $428 | $10,050 | $2,300 | $7,750 |
| 2017 | $430 | $10,050 | $2,300 | $7,750 |
| 2016 | $428 | $10,100 | $2,300 | $7,800 |
| 2015 | $429 | $10,100 | $2,300 | $7,800 |
| 2014 | $500 | $11,700 | $2,300 | $9,400 |
Source: Public Records
Map
Nearby Homes
- 728 S Watauga Ave
- TBD Watuaga
- 732 S Watauga Ave
- 725 S Watauga Ave
- 718 S Watauga Ave
- 727 S Watauga Ave
- 723 S Watauga Ave
- 717 S Watauga Ave
- 121 Hazelnut St
- 714 S Watauga Ave
- 729 S Lynn Ave
- 733 S Watauga Ave
- 733 S Watauga Ave
- 125 Church St
- 731 S Lynn Ave
- 0 Church St
- TBD Church St
- 250 Church St
- 215 Church St
- 712 S Watauga Ave