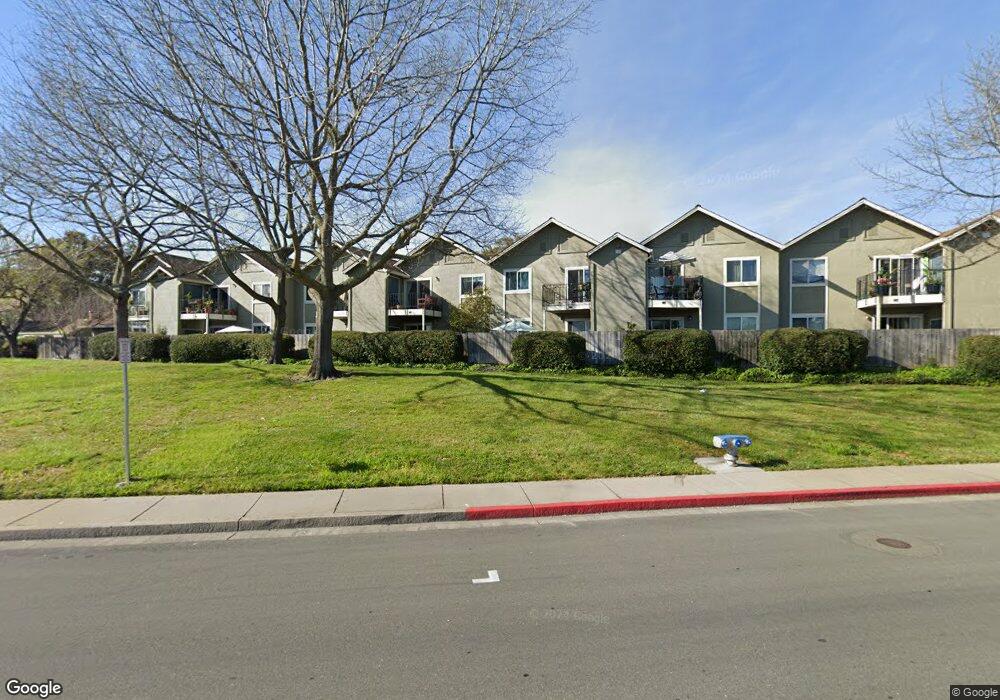
726 Santa Alicia Dr Rohnert Park, CA 94928
Estimated Value: $299,000 - $421,000
2
Beds
1
Bath
697
Sq Ft
$496/Sq Ft
Est. Value
About This Home
This home is located at 726 Santa Alicia Dr, Rohnert Park, CA 94928 and is currently estimated at $345,975, approximately $496 per square foot. 726 Santa Alicia Dr is a home located in Sonoma County with nearby schools including Rancho Cotate High School, Cross & Crown Lutheran School, and Bridghaven.
Ownership History
Date
Name
Owned For
Owner Type
Purchase Details
Closed on
Jul 24, 2008
Sold by
Jankoski Thomas A and Jankoski Dana M
Bought by
Jankoski Thomas A and Jankoski Dana M
Current Estimated Value
Purchase Details
Closed on
May 4, 2004
Sold by
Anderson W E and Obrien Daniel J
Bought by
Jankoski Thomas A and Jankoski Dana M
Home Financials for this Owner
Home Financials are based on the most recent Mortgage that was taken out on this home.
Original Mortgage
$161,250
Outstanding Balance
$74,965
Interest Rate
5.38%
Mortgage Type
Purchase Money Mortgage
Estimated Equity
$271,010
Purchase Details
Closed on
Jul 24, 1996
Sold by
Hud
Bought by
Anderson W E and Obrien Daniel J
Purchase Details
Closed on
Mar 14, 1996
Sold by
Pereira Robert J and Pereira Billie Ann
Bought by
Norwest Mtg Inc
Purchase Details
Closed on
Mar 6, 1996
Sold by
Norwest Mtg Inc
Bought by
Hud
Create a Home Valuation Report for This Property
The Home Valuation Report is an in-depth analysis detailing your home's value as well as a comparison with similar homes in the area
Home Values in the Area
Average Home Value in this Area
Purchase History
| Date | Buyer | Sale Price | Title Company |
|---|---|---|---|
| Jankoski Thomas A | -- | None Available | |
| Jankoski Thomas A | $215,000 | Old Republic Title Company | |
| Anderson W E | $111,000 | North American Title Co | |
| Norwest Mtg Inc | -- | First American Title | |
| Hud | -- | First American Title |
Source: Public Records
Mortgage History
| Date | Status | Borrower | Loan Amount |
|---|---|---|---|
| Open | Jankoski Thomas A | $161,250 |
Source: Public Records
Tax History Compared to Growth
Tax History
| Year | Tax Paid | Tax Assessment Tax Assessment Total Assessment is a certain percentage of the fair market value that is determined by local assessors to be the total taxable value of land and additions on the property. | Land | Improvement |
|---|---|---|---|---|
| 2025 | $3,544 | $305,664 | $142,171 | $163,493 |
| 2024 | $3,544 | $299,672 | $139,384 | $160,288 |
| 2023 | $3,544 | $293,797 | $136,651 | $157,146 |
| 2022 | $3,475 | $288,037 | $133,972 | $154,065 |
| 2021 | $3,447 | $282,391 | $131,346 | $151,045 |
| 2020 | $3,496 | $279,497 | $130,000 | $149,497 |
| 2019 | $3,452 | $274,017 | $127,451 | $146,566 |
| 2018 | $3,386 | $268,645 | $124,952 | $143,693 |
| 2017 | $3,107 | $245,000 | $114,000 | $131,000 |
| 2016 | $2,345 | $187,000 | $87,000 | $100,000 |
| 2015 | $2,240 | $180,000 | $84,000 | $96,000 |
| 2014 | $2,088 | $165,000 | $77,000 | $88,000 |
Source: Public Records
Map
Nearby Homes
- 7301 Willlowglen Dr
- 7316 Willowglen Dr
- 530 Anson Ct
- 77 Walnut Cir
- 566 Santa Alicia Dr
- 138 Walnut Cir
- 478 Santa Alicia Dr
- 6440 Country Club Dr
- 211 Apple Ln
- 746 Bernadette Ave
- 6469 Meadow Pines Ave
- 928 Civic Center Dr
- 641 Racquet Club Cir
- 7530 Bernice Ave
- 1022 Civic Center Dr Unit 33
- 6365 San Benito Way
- 6454 Amberwood St
- 6162 Country Club Dr Unit 26
- 229 Arlen Dr
- 950 Santa Alicia Dr
- 724 Santa Alicia Dr
- 728 Santa Alicia Dr
- 720 Santa Alicia Dr Unit 37
- 722 Santa Alicia Dr
- 732 Santa Alicia Dr
- 734 Santa Alicia Dr Unit 42
- 718 Santa Alicia Dr
- 716 Santa Alicia Dr
- 738 Santa Alicia Dr Unit 44
- 736 Santa Alicia Dr Unit 45
- 738 Santa Alicia Dr
- 714 Santa Alicia Dr Unit B
- 712 Santa Alicia Dr
- 714 Santa Alicia Dr
- 742 Santa Alicia Dr
- 740 Santa Alicia Dr
- 744 Santa Alicia Dr
- 746 Santa Alicia Dr
- 708 Santa Alicia Dr Unit 31
- 710 Santa Alicia Dr