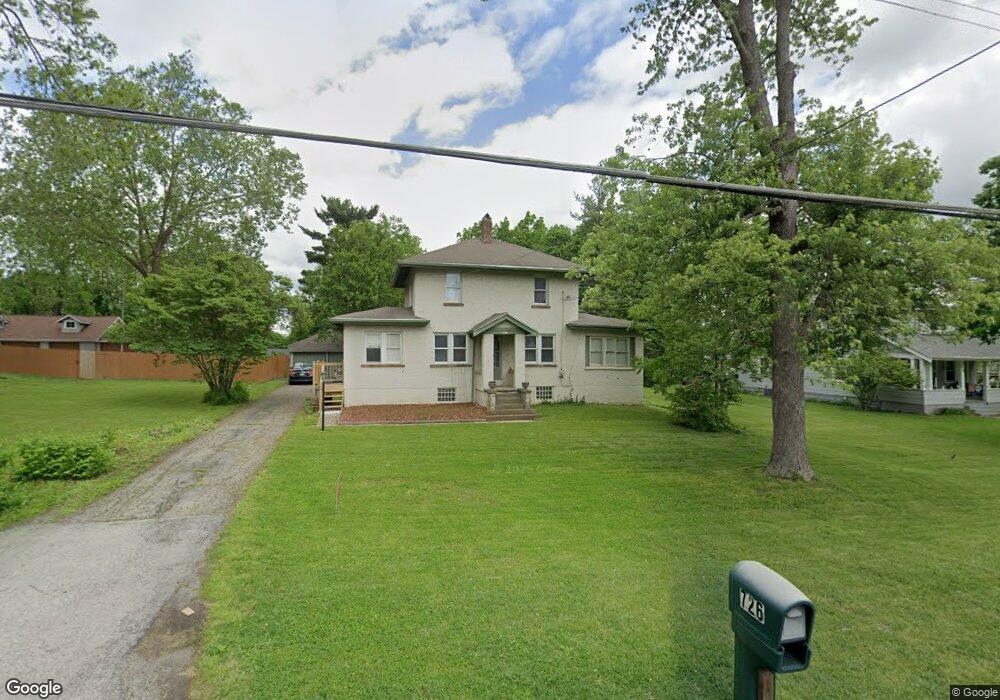
726 W Kemper Rd Cincinnati, OH 45246
Estimated Value: $218,632 - $312,000
3
Beds
1
Bath
1,340
Sq Ft
$186/Sq Ft
Est. Value
About This Home
This home is located at 726 W Kemper Rd, Cincinnati, OH 45246 and is currently estimated at $248,658, approximately $185 per square foot. 726 W Kemper Rd is a home located in Hamilton County with nearby schools including Springdale Elementary School, Princeton Community Middle School, and Princeton High School.
Ownership History
Date
Name
Owned For
Owner Type
Purchase Details
Closed on
May 15, 2019
Sold by
Caprioni Michael and Caprioni Carole J
Bought by
Madden Erica L
Current Estimated Value
Home Financials for this Owner
Home Financials are based on the most recent Mortgage that was taken out on this home.
Original Mortgage
$127,645
Outstanding Balance
$113,158
Interest Rate
4.62%
Mortgage Type
FHA
Estimated Equity
$135,500
Purchase Details
Closed on
Jul 15, 2004
Sold by
Mollet Brenda Jo
Bought by
Caprioni Michael and Caprioni Carole J
Home Financials for this Owner
Home Financials are based on the most recent Mortgage that was taken out on this home.
Original Mortgage
$102,400
Interest Rate
5.62%
Mortgage Type
Fannie Mae Freddie Mac
Purchase Details
Closed on
Oct 23, 2003
Sold by
Cooper Cecil C and Burch Dorothy M
Bought by
Mollett Brenda Jo and The Brenda Jo Mollett Trust
Create a Home Valuation Report for This Property
The Home Valuation Report is an in-depth analysis detailing your home's value as well as a comparison with similar homes in the area
Home Values in the Area
Average Home Value in this Area
Purchase History
| Date | Buyer | Sale Price | Title Company |
|---|---|---|---|
| Madden Erica L | $130,000 | None Available | |
| Caprioni Michael | $128,000 | -- | |
| Mollett Brenda Jo | $65,000 | -- |
Source: Public Records
Mortgage History
| Date | Status | Borrower | Loan Amount |
|---|---|---|---|
| Open | Madden Erica L | $127,645 | |
| Previous Owner | Caprioni Michael | $102,400 |
Source: Public Records
Tax History Compared to Growth
Tax History
| Year | Tax Paid | Tax Assessment Tax Assessment Total Assessment is a certain percentage of the fair market value that is determined by local assessors to be the total taxable value of land and additions on the property. | Land | Improvement |
|---|---|---|---|---|
| 2024 | $2,647 | $61,184 | $17,273 | $43,911 |
| 2023 | $2,650 | $61,184 | $17,273 | $43,911 |
| 2022 | $2,421 | $45,500 | $22,456 | $23,044 |
| 2021 | $2,356 | $45,500 | $22,456 | $23,044 |
| 2020 | $2,383 | $45,500 | $22,456 | $23,044 |
| 2019 | $2,208 | $38,938 | $19,194 | $19,744 |
| 2018 | $2,078 | $38,938 | $19,194 | $19,744 |
| 2017 | $1,952 | $38,938 | $19,194 | $19,744 |
| 2016 | $1,895 | $37,507 | $19,191 | $18,316 |
| 2015 | $1,913 | $37,507 | $19,191 | $18,316 |
| 2014 | $1,919 | $37,507 | $19,191 | $18,316 |
| 2013 | $1,895 | $37,884 | $19,383 | $18,501 |
Source: Public Records
Map
Nearby Homes
- 780 Fairborn Rd
- 11649 Kenn Rd
- 11481 Fremantle Dr
- 659 W Kemper Rd
- 11435 Fitchburg Ln
- 755 Hanson Dr
- 11442 Gresham Place
- 918 Glasgow Dr
- 11761 Hanover Rd
- 11696 Hinkley Dr
- 21 Aspen Ct
- 745 Evangeline Rd
- 967 Harrogate Ct
- 962 Harrogate Ct
- 484 W Kemper Rd
- 11131 Hanover Rd
- 11233 Embassy Dr
- 774 Northland Blvd
- 12069 Cantrell Dr
- 11842 Hitchcock Dr
- 720 W Kemper Rd
- 732 W Kemper Rd
- 712 W Kemper Rd
- 740 W Kemper Rd
- 735 W Kemper Rd
- 731 W Kemper Rd
- 727 W Kemper Rd
- 739 W Kemper Rd
- 721 W Kemper Rd
- 743 W Kemper Rd
- 746 W Kemper Rd
- 706 W Kemper Rd
- 717 W Kemper Rd
- 747 W Kemper Rd
- 732 Fairborn Rd
- 736 Fairborn Rd
- 728 Fairborn Rd
- 740 Fairborn Rd
- 724 Fairborn Rd
- 11620 Kenn Rd