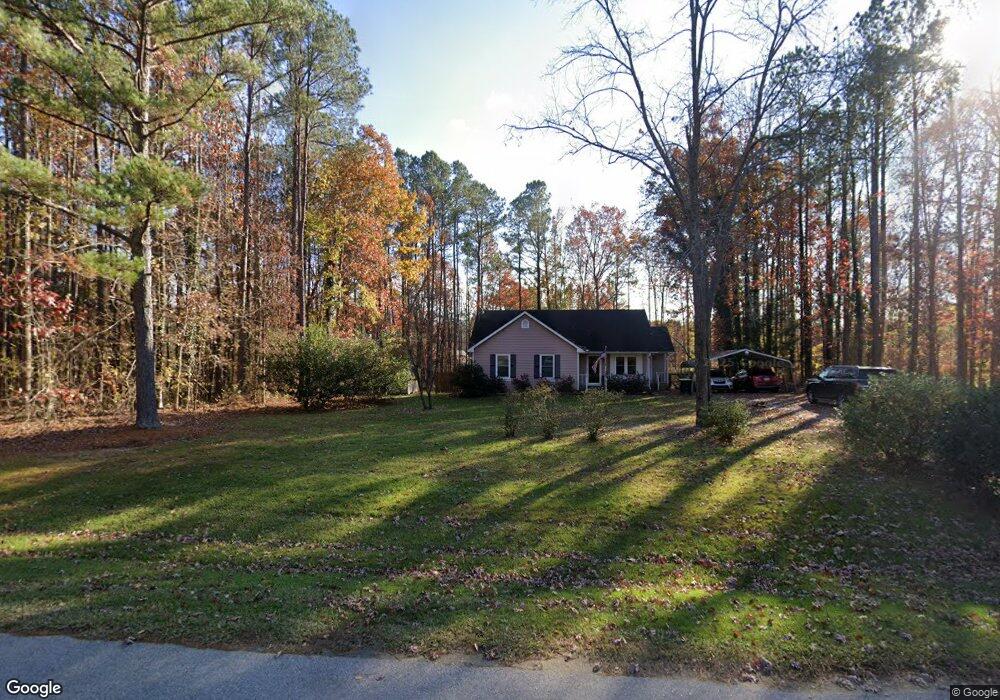
7260 Hunt Valley Trail Unit 1 Wendell, NC 27591
Estimated Value: $267,000 - $327,000
3
Beds
2
Baths
1,160
Sq Ft
$252/Sq Ft
Est. Value
About This Home
This home is located at 7260 Hunt Valley Trail Unit 1, Wendell, NC 27591 and is currently estimated at $291,928, approximately $251 per square foot. 7260 Hunt Valley Trail Unit 1 is a home located in Wake County with nearby schools including Carver Elementary, Wendell Middle School, and East Wake High School.
Ownership History
Date
Name
Owned For
Owner Type
Purchase Details
Closed on
Mar 30, 2012
Sold by
Harris Adrian T
Bought by
The Secretary Of Housing & Urban Develop
Current Estimated Value
Purchase Details
Closed on
Jul 25, 2008
Sold by
Tew Sara F and Tew Marty S
Bought by
Harris Adrian T
Home Financials for this Owner
Home Financials are based on the most recent Mortgage that was taken out on this home.
Original Mortgage
$127,890
Interest Rate
6.37%
Mortgage Type
FHA
Purchase Details
Closed on
Apr 25, 2002
Sold by
Gates Carol Elizabeth and Broadwell James Harold
Bought by
Fisher Sara E
Home Financials for this Owner
Home Financials are based on the most recent Mortgage that was taken out on this home.
Original Mortgage
$101,855
Interest Rate
7.07%
Mortgage Type
FHA
Create a Home Valuation Report for This Property
The Home Valuation Report is an in-depth analysis detailing your home's value as well as a comparison with similar homes in the area
Home Values in the Area
Average Home Value in this Area
Purchase History
| Date | Buyer | Sale Price | Title Company |
|---|---|---|---|
| The Secretary Of Housing & Urban Develop | $134,093 | None Available | |
| Harris Adrian T | $130,000 | None Available | |
| Fisher Sara E | $103,500 | -- |
Source: Public Records
Mortgage History
| Date | Status | Borrower | Loan Amount |
|---|---|---|---|
| Previous Owner | Harris Adrian T | $127,890 | |
| Previous Owner | Fisher Sara E | $101,855 |
Source: Public Records
Tax History Compared to Growth
Tax History
| Year | Tax Paid | Tax Assessment Tax Assessment Total Assessment is a certain percentage of the fair market value that is determined by local assessors to be the total taxable value of land and additions on the property. | Land | Improvement |
|---|---|---|---|---|
| 2025 | $1,506 | $232,303 | $70,000 | $162,303 |
| 2024 | $1,463 | $232,303 | $70,000 | $162,303 |
| 2023 | $1,304 | $164,716 | $47,000 | $117,716 |
| 2022 | $1,210 | $164,716 | $47,000 | $117,716 |
| 2021 | $1,177 | $164,716 | $47,000 | $117,716 |
| 2020 | $1,158 | $164,716 | $47,000 | $117,716 |
| 2019 | $965 | $115,674 | $30,000 | $85,674 |
| 2018 | $888 | $115,674 | $30,000 | $85,674 |
| 2017 | $842 | $115,674 | $30,000 | $85,674 |
| 2016 | $0 | $115,674 | $30,000 | $85,674 |
| 2015 | -- | $112,890 | $28,000 | $84,890 |
| 2014 | -- | $112,890 | $28,000 | $84,890 |
Source: Public Records
Map
Nearby Homes
- 7264 Hunt Valley Trail
- 7240 Shawan Rd
- 7284 Shawan Rd
- 7708 Cortona Way
- 7327 Shawan Rd
- 7331 Shawan Rd
- 7805 Tuscan Ridge Dr
- 246 Gin Branch Rd
- Redwood Plan at Grove at Gin Branch - Grove At Gin Branch
- Allegheny Plan at Grove at Gin Branch - Southern
- Voyageur Plan at Grove at Gin Branch - Grove At Gin Branch
- Teton Plan at Grove at Gin Branch - Grove At Gin Branch
- Shenandoah Plan at Grove at Gin Branch - Grove At Gin Branch
- Clearwater Plan at Grove at Gin Branch - Southern
- Sequoia Plan at Grove at Gin Branch - Grove At Gin Branch
- Harper Plan at Eagle Trace
- Quincy Plan at Eagle Trace
- Hamilton Plan at Eagle Trace
- Ashford Plan at Eagle Trace
- Andrews Plan at Eagle Trace
- 7260 Hunt Valley Trail
- 7252 Hunt Valley Trail
- 7261 Beau View Dr Unit 39
- 7261 Beau View Dr
- 7257 Hunt Valley Trail
- 7261 Hunt Valley Trail
- 7253 Hunt Valley Trail
- 7253 Beau View Dr
- 7253 Beau View Dr Unit 40
- 0 Beau View Dr
- 0.0 Beau View Dr
- 7265 Hunt Valley Trail
- 7265 Beau View Dr
- 7265 Beau View Dr Unit 38
- 7272 Hunt Valley Trail
- 7244 Hunt Valley Trail
- 7249 Hunt Valley Trail
- 7237 Beau View Dr
- 7237 Beau View Dr Unit 41
- 7269 Hunt Valley Trail