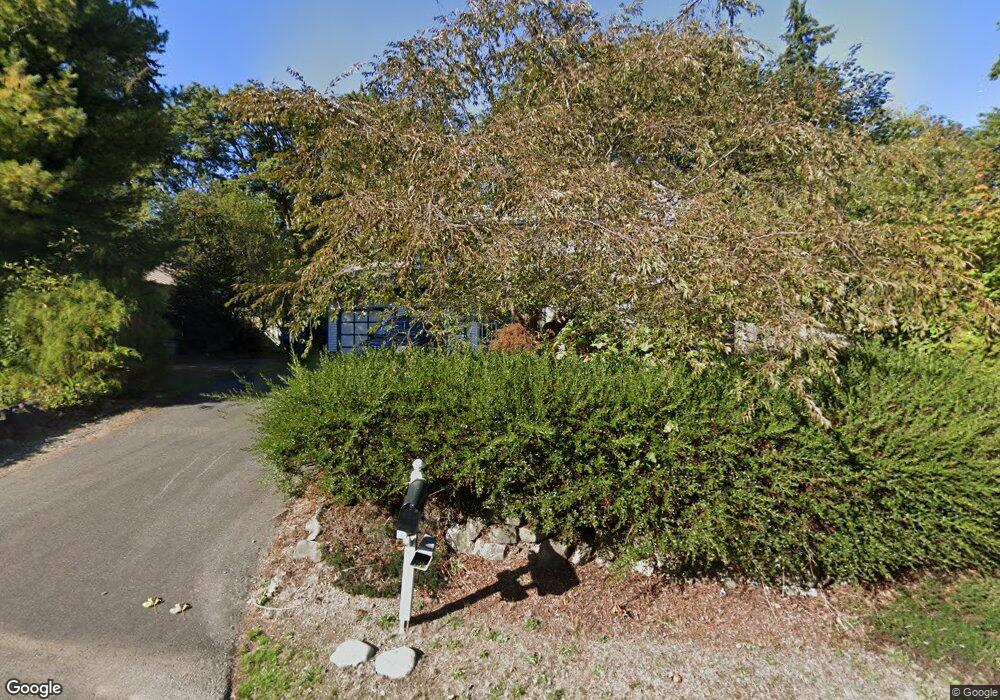
7263 E Fillmore St Port Orchard, WA 98366
Manchester NeighborhoodEstimated Value: $450,571 - $466,000
3
Beds
2
Baths
1,316
Sq Ft
$348/Sq Ft
Est. Value
About This Home
This home is located at 7263 E Fillmore St, Port Orchard, WA 98366 and is currently estimated at $457,643, approximately $347 per square foot. 7263 E Fillmore St is a home located in Kitsap County with nearby schools including Manchester Elementary School, John Sedgwick Middle School, and South Kitsap High School.
Ownership History
Date
Name
Owned For
Owner Type
Purchase Details
Closed on
Aug 16, 2002
Sold by
Oswalt Lawrence Bowden
Bought by
Oswalt Donna Jean
Current Estimated Value
Create a Home Valuation Report for This Property
The Home Valuation Report is an in-depth analysis detailing your home's value as well as a comparison with similar homes in the area
Home Values in the Area
Average Home Value in this Area
Purchase History
| Date | Buyer | Sale Price | Title Company |
|---|---|---|---|
| Oswalt Donna Jean | -- | -- |
Source: Public Records
Tax History Compared to Growth
Tax History
| Year | Tax Paid | Tax Assessment Tax Assessment Total Assessment is a certain percentage of the fair market value that is determined by local assessors to be the total taxable value of land and additions on the property. | Land | Improvement |
|---|---|---|---|---|
| 2026 | $596 | $395,230 | $94,980 | $300,250 |
| 2025 | $596 | $395,230 | $94,980 | $300,250 |
| 2024 | $583 | $395,230 | $94,980 | $300,250 |
| 2023 | $555 | $395,230 | $94,980 | $300,250 |
| 2022 | $623 | $316,050 | $75,850 | $240,200 |
| 2021 | $648 | $275,370 | $65,960 | $209,410 |
| 2020 | $2,834 | $258,880 | $59,650 | $199,230 |
| 2019 | $2,444 | $245,190 | $56,390 | $188,800 |
| 2018 | $2,559 | $192,880 | $48,930 | $143,950 |
| 2017 | $2,120 | $192,880 | $48,930 | $143,950 |
| 2016 | $2,063 | $171,770 | $46,600 | $125,170 |
| 2015 | $1,998 | $168,640 | $46,600 | $122,040 |
| 2014 | -- | $156,040 | $48,050 | $107,990 |
| 2013 | -- | $156,040 | $48,050 | $107,990 |
Source: Public Records
Map
Nearby Homes
- 802 California Ave SE
- 7143 SE Grant St
- 7166 E Fillmore St
- 7847 SE Monte Bella Place
- 1083 Puget Dr E
- 1381 Alaska Ave SE
- 8009 E Commons Ct
- 7104 SE Kansas St
- 8151 E Seaview Dr
- 8185 E Seaview Dr
- 1313 Colchester Dr SE
- 7085 SE Legrand St
- 1630 & 1632 Colchester Dr E
- 7549 E Alki View Ct
- 6521 SE Mile Hill Dr Unit 23
- 7748 E Hemlock St
- 1738 Lilypad Place E
- 7230 E Maple St
- 2216 Yukon Harbor Rd SE
- 2372 Valley Ave E
- 7257 E Fillmore St
- 7269 E Fillmore St
- 7340 E Taylor St
- 7253 E Fillmore St
- 7348 E Taylor St
- 7356 E Taylor St
- 7275 E Fillmore St
- 7258 E Fillmore St
- 7324 E Taylor St
- 7262 E Fillmore St
- 7249 E Fillmore St
- 7266 E Fillmore St
- 7250 E Fillmore St
- 7316 E Taylor St
- 7245 E Fillmore St
- 902 Alaska Ave E
- 902 Alaska Ave E
- 7246 E Fillmore St
- 980 Alaska Ave E
- 7308 E Taylor St