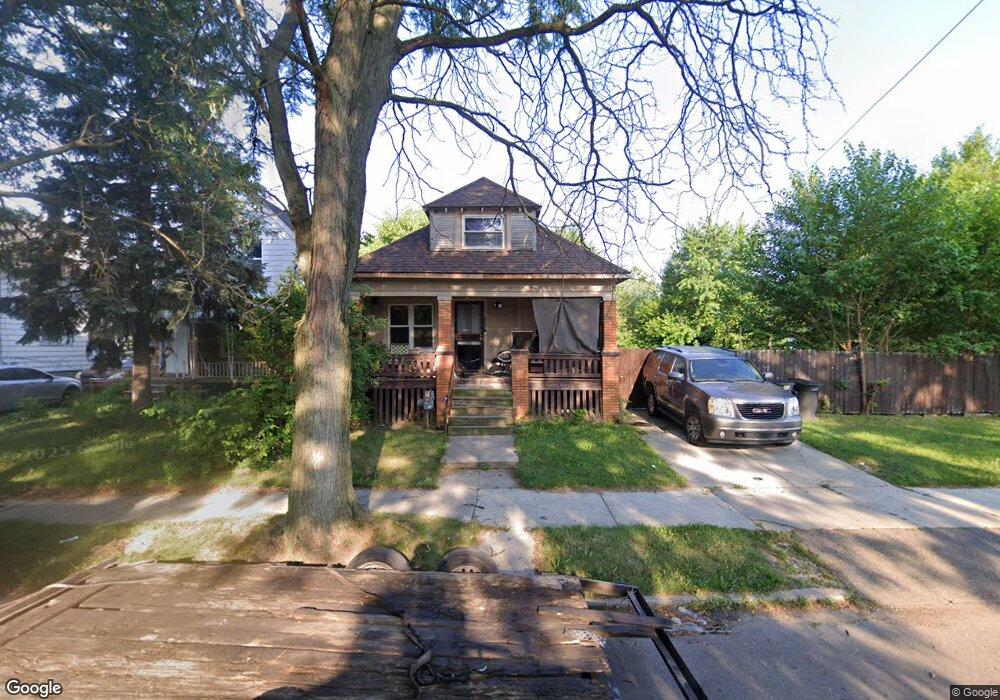
7269 Warwick St Detroit, MI 48228
Franklin Park NeighborhoodEstimated Value: $90,528 - $120,000
3
Beds
3
Baths
1,300
Sq Ft
$81/Sq Ft
Est. Value
About This Home
This home is located at 7269 Warwick St, Detroit, MI 48228 and is currently estimated at $105,882, approximately $81 per square foot. 7269 Warwick St is a home located in Wayne County with nearby schools including Bates Academy, Charles L. Spain Elementary-Middle School, and Edward 'Duke' Ellington Conservatory of Music and Art.
Ownership History
Date
Name
Owned For
Owner Type
Purchase Details
Closed on
Nov 7, 2020
Sold by
Williams Romeiro
Bought by
Afful Eric Ebo
Current Estimated Value
Purchase Details
Closed on
Mar 12, 2013
Sold by
Escoe Kecia
Bought by
Williams Romero
Purchase Details
Closed on
Nov 16, 2012
Sold by
Wayne County Treasurer
Bought by
Escoe Kecia
Purchase Details
Closed on
Sep 30, 2011
Sold by
Jackson Andre
Bought by
Williams Romiero
Purchase Details
Closed on
Feb 3, 2010
Sold by
G8 Capital Fund V Llc
Bought by
Jackson Andre
Purchase Details
Closed on
Oct 2, 2009
Sold by
Wells Fargo Bank Na
Bought by
G8 Capital Fund V Llc
Purchase Details
Closed on
Nov 26, 2008
Sold by
Al Hasnawi Mohammed and Al Hisnawi Mohammed
Bought by
Wells Fargo Bank Na
Purchase Details
Closed on
Sep 16, 1994
Sold by
Durocher Mary
Bought by
Jozef Kutyma
Create a Home Valuation Report for This Property
The Home Valuation Report is an in-depth analysis detailing your home's value as well as a comparison with similar homes in the area
Home Values in the Area
Average Home Value in this Area
Purchase History
| Date | Buyer | Sale Price | Title Company |
|---|---|---|---|
| Afful Eric Ebo | -- | None Listed On Document | |
| Afful Eric Ebo | -- | None Listed On Document | |
| Williams Romero | -- | None Available | |
| Escoe Kecia | $500 | None Available | |
| Williams Romiero | -- | None Available | |
| Jackson Andre | $960 | None Available | |
| G8 Capital Fund V Llc | -- | None Available | |
| Wells Fargo Bank Na | $8,500 | None Available | |
| Jozef Kutyma | $12,000 | -- |
Source: Public Records
Tax History Compared to Growth
Tax History
| Year | Tax Paid | Tax Assessment Tax Assessment Total Assessment is a certain percentage of the fair market value that is determined by local assessors to be the total taxable value of land and additions on the property. | Land | Improvement |
|---|---|---|---|---|
| 2025 | $1,297 | $41,200 | $0 | $0 |
| 2024 | $1,297 | $34,700 | $0 | $0 |
| 2023 | $1,258 | $27,100 | $0 | $0 |
| 2022 | $489 | $19,700 | $0 | $0 |
| 2021 | $1,065 | $15,700 | $0 | $0 |
| 2020 | $1,054 | $14,000 | $0 | $0 |
| 2019 | $1,039 | $12,300 | $0 | $0 |
| 2018 | $893 | $11,100 | $0 | $0 |
| 2017 | $216 | $11,400 | $0 | $0 |
| 2016 | $1,416 | $16,000 | $0 | $0 |
| 2015 | $1,599 | $16,000 | $0 | $0 |
| 2013 | $2,393 | $23,933 | $0 | $0 |
| 2010 | -- | $35,088 | $847 | $34,241 |
Source: Public Records
Map
Nearby Homes
- 7261 Piedmont St
- 7271 Piedmont St
- 7349 Warwick St
- 6851 Piedmont St
- 6900 Westwood St
- 7314 Westwood St
- 6760 Warwick St
- 7396 Stahelin Ave
- 6744 Artesian St
- 7269 Minock St
- 18940 Sawyer St
- 6712 Artesian St
- 6722 Stahelin Ave
- 6850 Auburn St
- 7366 Auburn St
- 7683 Warwick St
- 7275 Auburn St
- 7254 Faust Ave
- 7716 Piedmont St
- 7716 Artesian St
- 7281 Warwick St
- 7261 Warwick St
- 7255 Warwick St
- 7287 Warwick St
- 7293 Warwick St
- 7270 Piedmont St
- 7260 Piedmont St
- 7245 Warwick St
- 7278 Piedmont St
- 7301 Warwick St
- 7252 Piedmont St
- 7237 Warwick St
- 7284 Piedmont St
- 7270 Warwick St
- 7276 Warwick St
- 7276 Warwick St
- 7260 Warwick St
- 7244 Piedmont St
- 7284 Warwick St
- 7252 Warwick St