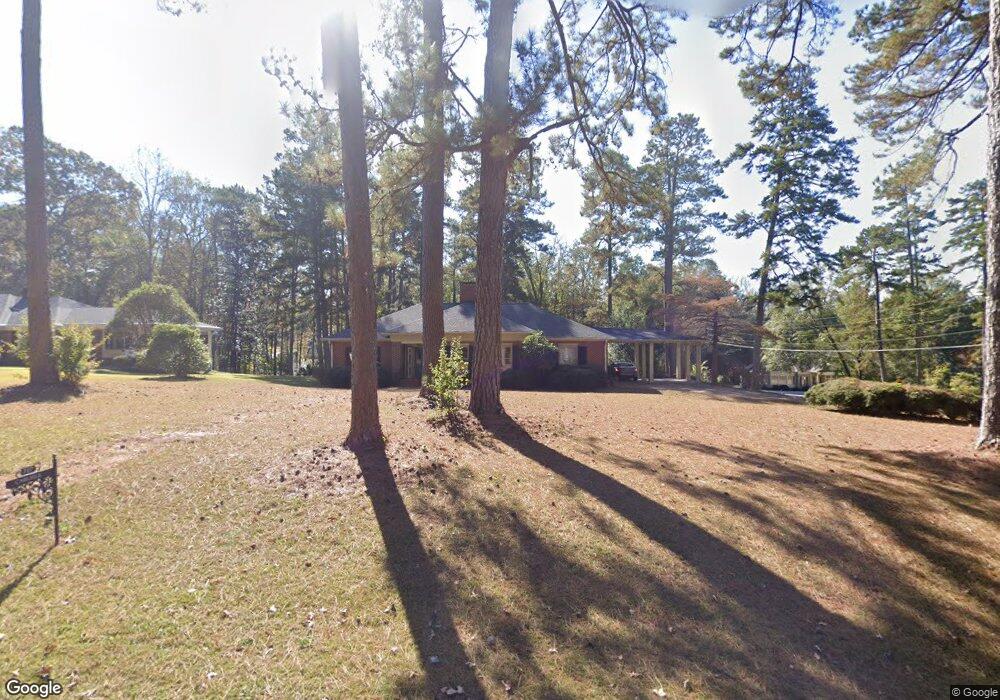
727 Larose Terrace Unit 21 Lagrange, GA 30240
Estimated Value: $368,787 - $427,000
3
Beds
2
Baths
2,915
Sq Ft
$133/Sq Ft
Est. Value
About This Home
This home is located at 727 Larose Terrace Unit 21, Lagrange, GA 30240 and is currently estimated at $387,947, approximately $133 per square foot. 727 Larose Terrace Unit 21 is a home located in Troup County with nearby schools including Hollis Hand Elementary School, Franklin Forest Elementary School, and Ethel W. Kight Elementary School.
Ownership History
Date
Name
Owned For
Owner Type
Purchase Details
Closed on
Nov 24, 2021
Sold by
Arndt Donald C
Bought by
Carlisle Thomas Dixon and Carlisle Sara Ann
Current Estimated Value
Home Financials for this Owner
Home Financials are based on the most recent Mortgage that was taken out on this home.
Original Mortgage
$290,000
Outstanding Balance
$265,595
Interest Rate
3.14%
Mortgage Type
New Conventional
Estimated Equity
$122,352
Purchase Details
Closed on
Mar 20, 2015
Sold by
Cleaveland John Pearce
Bought by
Arndt Donald C and Arndt Rachel J
Home Financials for this Owner
Home Financials are based on the most recent Mortgage that was taken out on this home.
Original Mortgage
$175,659
Interest Rate
4.4%
Mortgage Type
FHA
Purchase Details
Closed on
Jan 1, 1953
Sold by
Ida C Callaway Fdn
Bought by
Cleaveland J Pearce
Create a Home Valuation Report for This Property
The Home Valuation Report is an in-depth analysis detailing your home's value as well as a comparison with similar homes in the area
Home Values in the Area
Average Home Value in this Area
Purchase History
| Date | Buyer | Sale Price | Title Company |
|---|---|---|---|
| Carlisle Thomas Dixon | $290,000 | -- | |
| Arndt Donald C | $178,900 | -- | |
| Cleaveland J Pearce | -- | -- |
Source: Public Records
Mortgage History
| Date | Status | Borrower | Loan Amount |
|---|---|---|---|
| Open | Carlisle Thomas Dixon | $290,000 | |
| Previous Owner | Arndt Donald C | $175,659 |
Source: Public Records
Tax History Compared to Growth
Tax History
| Year | Tax Paid | Tax Assessment Tax Assessment Total Assessment is a certain percentage of the fair market value that is determined by local assessors to be the total taxable value of land and additions on the property. | Land | Improvement |
|---|---|---|---|---|
| 2024 | $3,105 | $115,840 | $18,000 | $97,840 |
| 2023 | $3,024 | $112,880 | $18,000 | $94,880 |
| 2022 | $2,974 | $108,560 | $18,000 | $90,560 |
| 2021 | $2,777 | $92,080 | $18,000 | $74,080 |
| 2020 | $2,777 | $92,080 | $18,000 | $74,080 |
| 2019 | $2,105 | $69,800 | $12,560 | $57,240 |
| 2018 | $2,105 | $69,800 | $12,560 | $57,240 |
| 2017 | $1,972 | $65,400 | $9,800 | $55,600 |
| 2016 | $1,911 | $63,371 | $9,800 | $53,571 |
| 2015 | $1,931 | $63,922 | $12,583 | $51,339 |
| 2014 | $1,853 | $61,220 | $12,583 | $48,637 |
| 2013 | -- | $64,903 | $11,860 | $53,043 |
Source: Public Records
Map
Nearby Homes
- 603 Country Club Rd
- 705 Piney Woods Dr
- 609 Cherokee Rd
- 748 Lakewood Dr
- 203 Waverly Way
- 109 Waverly Way
- 105 Saynor Cir
- 145 Turner St
- 110 Waverly Way
- 724 Camellia Dr
- 102 Ewing St
- 106 Ewing St
- 408 Gordon St
- 203 S Chilton Crescent
- 201 S Chilton Crescent
- 109 Thomas St
- 219 Banks St
- 106 S Chilton Crescent
- 900 North St
- 209 N Lee St
- 727 Larose Terrace
- 723 Larose Terrace
- 842 Cherokee Rd
- 717 Larose Terrace
- 610 Ridgecrest Rd
- 728 Larose Terrace
- 0 Larose Terrace Unit 8017631
- 841 Cherokee Rd
- 841 Cherokee Rd Unit 47
- 724 Larose Terrace
- 838 Cherokee Rd
- 700 Ridgecrest Rd
- 718 Larose Terrace
- 600 Ridgecrest Rd
- 711 Larose Terrace
- 854 Cherokee Rd
- 855 Cherokee Rd
- 712 Larose Terrace
- 528 Ridgecrest Rd
- 707 Larose Terrace