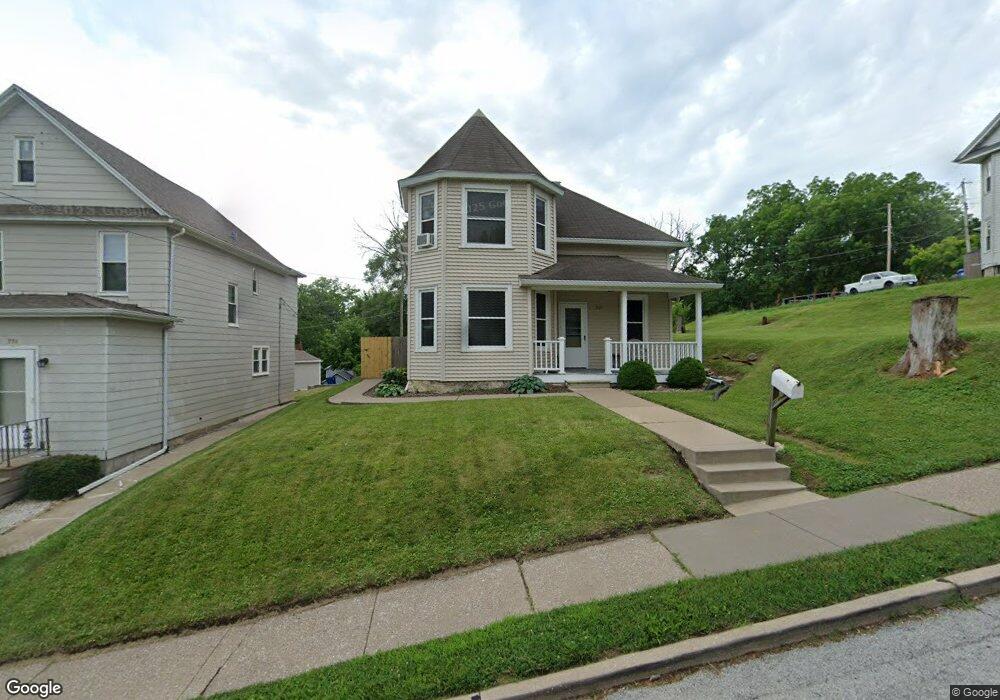
727 Sylvan Ct Davenport, IA 52803
Central Davenport NeighborhoodEstimated Value: $110,000 - $124,110
4
Beds
2
Baths
1,703
Sq Ft
$68/Sq Ft
Est. Value
About This Home
This home is located at 727 Sylvan Ct, Davenport, IA 52803 and is currently estimated at $116,028, approximately $68 per square foot. 727 Sylvan Ct is a home located in Scott County with nearby schools including Walnut Hill Elementary School, McKinley Elementary School, and Casey County Middle School.
Ownership History
Date
Name
Owned For
Owner Type
Purchase Details
Closed on
Jul 9, 2019
Sold by
Fennelly Mike
Bought by
Cade Terrell E
Current Estimated Value
Purchase Details
Closed on
Apr 13, 2012
Sold by
City Of Davenport
Bought by
Cade Terrell E
Home Financials for this Owner
Home Financials are based on the most recent Mortgage that was taken out on this home.
Original Mortgage
$1,000
Interest Rate
3.9%
Mortgage Type
Seller Take Back
Purchase Details
Closed on
Jun 29, 2009
Sold by
Mockmore William J
Bought by
City Of Davenport
Purchase Details
Closed on
Aug 19, 2005
Sold by
City Of Davenport
Bought by
Mockmore William J
Home Financials for this Owner
Home Financials are based on the most recent Mortgage that was taken out on this home.
Original Mortgage
$78,000
Interest Rate
5.8%
Mortgage Type
Purchase Money Mortgage
Create a Home Valuation Report for This Property
The Home Valuation Report is an in-depth analysis detailing your home's value as well as a comparison with similar homes in the area
Home Values in the Area
Average Home Value in this Area
Purchase History
| Date | Buyer | Sale Price | Title Company |
|---|---|---|---|
| Cade Terrell E | -- | -- | |
| Cade Terrell E | -- | None Available | |
| City Of Davenport | -- | None Available | |
| Mockmore William J | -- | None Available |
Source: Public Records
Mortgage History
| Date | Status | Borrower | Loan Amount |
|---|---|---|---|
| Previous Owner | Cade Terrell E | $1,000 | |
| Previous Owner | Mockmore William J | $78,000 |
Source: Public Records
Tax History Compared to Growth
Tax History
| Year | Tax Paid | Tax Assessment Tax Assessment Total Assessment is a certain percentage of the fair market value that is determined by local assessors to be the total taxable value of land and additions on the property. | Land | Improvement |
|---|---|---|---|---|
| 2025 | $1,616 | $100,660 | $15,120 | $85,540 |
| 2024 | $1,574 | $100,660 | $15,120 | $85,540 |
| 2023 | $394 | $100,660 | $15,120 | $85,540 |
| 2022 | $1,124 | $65,280 | $6,910 | $58,370 |
| 2021 | $1,124 | $99,010 | $6,910 | $92,100 |
| 2020 | $856 | $85,380 | $6,910 | $78,470 |
| 2019 | $916 | $85,380 | $6,910 | $78,470 |
| 2018 | $876 | $85,380 | $6,910 | $78,470 |
| 2017 | $475 | $85,380 | $6,910 | $78,470 |
| 2016 | $870 | $85,385 | $0 | $0 |
| 2015 | $870 | $73,835 | $0 | $0 |
| 2014 | $1,446 | $73,885 | $0 | $0 |
| 2013 | $1,418 | $0 | $0 | $0 |
| 2012 | -- | $72,910 | $5,510 | $67,400 |
Source: Public Records
Map
Nearby Homes