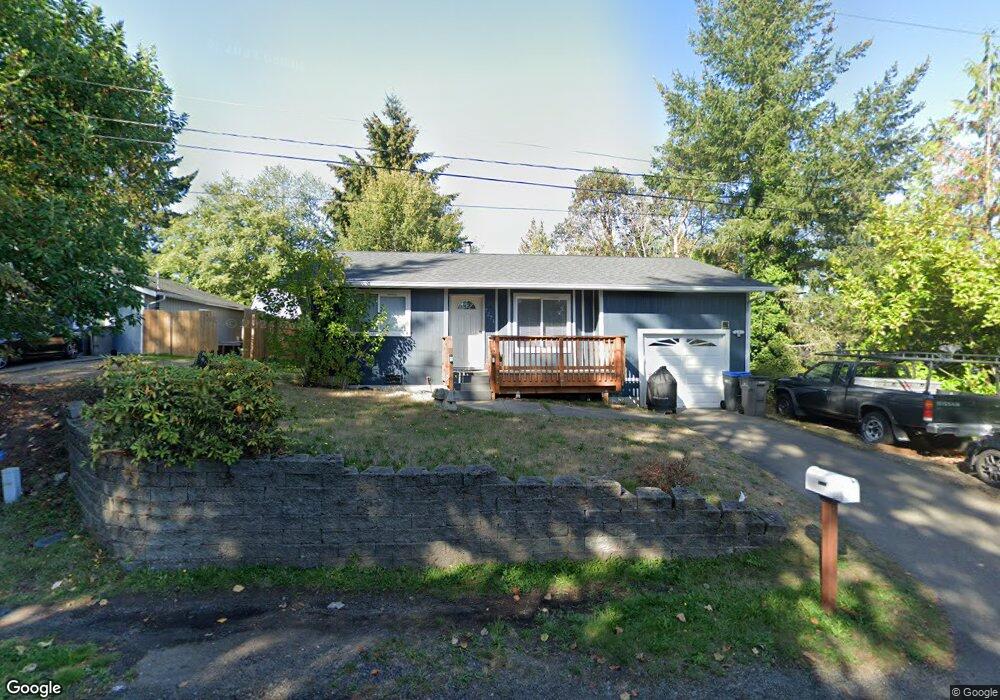
7271 E Patricia St Port Orchard, WA 98366
Manchester NeighborhoodEstimated Value: $333,000 - $390,063
2
Beds
1
Bath
879
Sq Ft
$420/Sq Ft
Est. Value
About This Home
This home is located at 7271 E Patricia St, Port Orchard, WA 98366 and is currently estimated at $369,266, approximately $420 per square foot. 7271 E Patricia St is a home located in Kitsap County with nearby schools including Manchester Elementary School, John Sedgwick Middle School, and South Kitsap High School.
Ownership History
Date
Name
Owned For
Owner Type
Purchase Details
Closed on
Nov 5, 2004
Sold by
Howe Jeremiah D and Howe Valerie
Bought by
Nelson Robert and Nelson Valerie
Current Estimated Value
Home Financials for this Owner
Home Financials are based on the most recent Mortgage that was taken out on this home.
Original Mortgage
$98,800
Outstanding Balance
$50,841
Interest Rate
6.25%
Mortgage Type
Stand Alone First
Estimated Equity
$318,425
Purchase Details
Closed on
Feb 20, 2002
Sold by
Howe Jeremiah D
Bought by
Howe Jeremiah D and Howe Valerie
Home Financials for this Owner
Home Financials are based on the most recent Mortgage that was taken out on this home.
Original Mortgage
$98,500
Interest Rate
7.04%
Purchase Details
Closed on
Nov 9, 2000
Sold by
Oster Patrick L and Oster Jamie L
Bought by
Howe Jeremiah D
Home Financials for this Owner
Home Financials are based on the most recent Mortgage that was taken out on this home.
Original Mortgage
$94,000
Interest Rate
7.82%
Create a Home Valuation Report for This Property
The Home Valuation Report is an in-depth analysis detailing your home's value as well as a comparison with similar homes in the area
Home Values in the Area
Average Home Value in this Area
Purchase History
| Date | Buyer | Sale Price | Title Company |
|---|---|---|---|
| Nelson Robert | $123,500 | Land Title Company | |
| Howe Jeremiah D | -- | Land Title Co | |
| Howe Jeremiah D | $99,000 | Land Title Company |
Source: Public Records
Mortgage History
| Date | Status | Borrower | Loan Amount |
|---|---|---|---|
| Open | Nelson Robert | $98,800 | |
| Previous Owner | Howe Jeremiah D | $98,500 | |
| Previous Owner | Howe Jeremiah D | $94,000 | |
| Closed | Nelson Robert | $24,700 |
Source: Public Records
Tax History Compared to Growth
Tax History
| Year | Tax Paid | Tax Assessment Tax Assessment Total Assessment is a certain percentage of the fair market value that is determined by local assessors to be the total taxable value of land and additions on the property. | Land | Improvement |
|---|---|---|---|---|
| 2026 | $2,973 | $337,880 | $91,200 | $246,680 |
| 2025 | $2,973 | $337,880 | $91,200 | $246,680 |
| 2024 | $2,883 | $337,880 | $91,200 | $246,680 |
| 2023 | $2,862 | $337,880 | $91,200 | $246,680 |
| 2022 | $2,735 | $270,170 | $72,830 | $197,340 |
| 2021 | $2,522 | $235,480 | $63,330 | $172,150 |
| 2020 | $2,196 | $198,180 | $58,370 | $139,810 |
| 2019 | $1,893 | $187,390 | $55,180 | $132,210 |
| 2018 | $1,980 | $148,460 | $47,880 | $100,580 |
| 2017 | $1,653 | $148,460 | $47,880 | $100,580 |
| 2016 | $1,624 | $133,530 | $45,600 | $87,930 |
| 2015 | $1,571 | $131,000 | $45,600 | $85,400 |
| 2014 | -- | $129,020 | $46,510 | $82,510 |
| 2013 | -- | $129,020 | $46,510 | $82,510 |
Source: Public Records
Map
Nearby Homes
- 5 Lots Lilypad Place E
- 7549 E Alki View Ct
- 1738 Lilypad Place E
- 7748 E Hemlock St
- 8009 E Commons Ct
- 802 California Ave SE
- 1083 Puget Dr E
- 7166 E Fillmore St
- 2372 Valley Ave E
- 1630 & 1632 Colchester Dr E
- 7143 SE Grant St
- 7548 E Grandview St
- 2440 Alaska Ave E
- 8185 E Seaview Dr
- 2585 Alaska Ave E
- 7847 SE Monte Bella Place
- 6418 E Royalview Ln
- 8079 E Main St Unit 341
- 7104 SE Kansas St
- 5957 E Collins Rd
- 7251 E Patricia St
- 7291 E Patricia St
- 7301 E Patricia St
- 7294 E Collins Rd
- 1226 E Patricia St
- 7284 E Collins Rd
- 7270 E Patricia St
- 7302 E Collins Rd
- 7221 E Patricia St
- 7311 E Patricia St
- 7274 E Collins Rd
- 7290 E Patricia St
- 7254 E Collins Rd
- 7306 E Collins Rd
- 7322 E Patricia St
- 7211 E Patricia St
- 7321 E Patricia St
- 7310 E Collins Rd