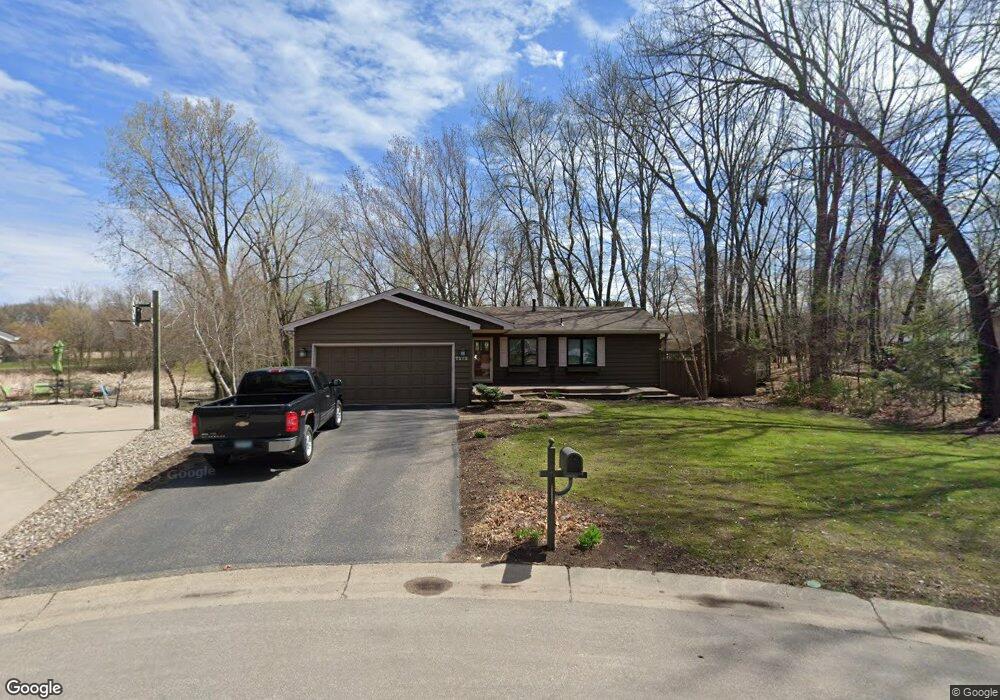
7275 Tartan Curve Eden Prairie, MN 55346
Estimated Value: $489,000 - $556,000
4
Beds
2
Baths
2,500
Sq Ft
$205/Sq Ft
Est. Value
About This Home
This home is located at 7275 Tartan Curve, Eden Prairie, MN 55346 and is currently estimated at $511,854, approximately $204 per square foot. 7275 Tartan Curve is a home located in Hennepin County with nearby schools including Prairie View Elementary School, Central Middle School, and Eden Prairie High School.
Ownership History
Date
Name
Owned For
Owner Type
Purchase Details
Closed on
Jun 10, 2020
Sold by
Wulf Mark G and Wulf Elizabeth A
Bought by
Misfeldt Scott and Misfeldt Nancy
Current Estimated Value
Home Financials for this Owner
Home Financials are based on the most recent Mortgage that was taken out on this home.
Original Mortgage
$391,500
Outstanding Balance
$347,035
Interest Rate
3.2%
Mortgage Type
New Conventional
Estimated Equity
$164,819
Purchase Details
Closed on
Jun 27, 2007
Sold by
Michalek Edward T and Michalek Jean R
Bought by
Wulf Mark G and Wulf Elizabeth A
Purchase Details
Closed on
May 26, 2000
Sold by
Robinson Stephen and Robinson Sileo
Bought by
Michalek Edward T
Purchase Details
Closed on
Aug 31, 1999
Sold by
Hedberg Daniel B and Gremore Hedberg Deborah A
Bought by
Robinson Stephen and Sileo Robinson Lesley
Create a Home Valuation Report for This Property
The Home Valuation Report is an in-depth analysis detailing your home's value as well as a comparison with similar homes in the area
Home Values in the Area
Average Home Value in this Area
Purchase History
| Date | Buyer | Sale Price | Title Company |
|---|---|---|---|
| Misfeldt Scott | $435,000 | Edina Realty Title Inc | |
| Wulf Mark G | $255,000 | -- | |
| Michalek Edward T | $214,900 | -- | |
| Robinson Stephen | $187,900 | -- |
Source: Public Records
Mortgage History
| Date | Status | Borrower | Loan Amount |
|---|---|---|---|
| Open | Misfeldt Scott | $391,500 |
Source: Public Records
Tax History Compared to Growth
Tax History
| Year | Tax Paid | Tax Assessment Tax Assessment Total Assessment is a certain percentage of the fair market value that is determined by local assessors to be the total taxable value of land and additions on the property. | Land | Improvement |
|---|---|---|---|---|
| 2024 | $5,571 | $469,600 | $173,200 | $296,400 |
| 2023 | $5,526 | $489,100 | $187,900 | $301,200 |
| 2022 | $4,976 | $446,200 | $171,400 | $274,800 |
| 2021 | $4,345 | $404,900 | $155,500 | $249,400 |
| 2020 | $4,593 | $359,600 | $138,900 | $220,700 |
| 2019 | $4,455 | $366,900 | $141,700 | $225,200 |
| 2018 | $4,460 | $352,500 | $151,400 | $201,100 |
| 2017 | $4,114 | $316,900 | $136,100 | $180,800 |
| 2016 | $4,104 | $313,900 | $134,800 | $179,100 |
| 2015 | $3,968 | $293,400 | $126,000 | $167,400 |
| 2014 | -- | $271,500 | $129,300 | $142,200 |
Source: Public Records
Map
Nearby Homes
- 18752 Kristie Ln
- 7080 Quail Cir
- 7182 Emerald Ln
- 7490 Chanhassen Rd
- 7239 Bren Ln
- 18086 Settlers Way
- 18266 Cascade Dr
- 18171 Settlers Way Unit 11
- 7690 Heritage Rd
- 7602 Erie Ave
- 17627 W 67th St
- 18863 Broadmoore Dr
- 303 W 77th St
- 8017 Lismore Cir
- 7406 Laredo Dr
- 7744 Carnelian Ln
- 18338 Dove Ct
- 5523 Game Farm Lookout
- 6620 Horseshoe Curve
- 601 Fox Hill Dr
- 7279 Tartan Curve
- 7277 Tartan Curve
- 7273 Tartan Curve
- 7281 Tartan Curve
- 7267 Tartan Curve
- 7271 Tartan Curve
- 7269 Tartan Curve
- 7280 Tartan Curve
- 7278 Tartan Curve
- 7282 Tartan Curve
- 7286 Tartan Curve
- 7265 Tartan Curve
- 7266 Tartan Curve
- 7284 Tartan Curve
- 7276 Tartan Curve
- 7236 Ticonderoga Trail
- 7234 Ticonderoga Trail
- 7264 Tartan Curve
- 18565 Valley View Rd
- 7274 Tartan Curve