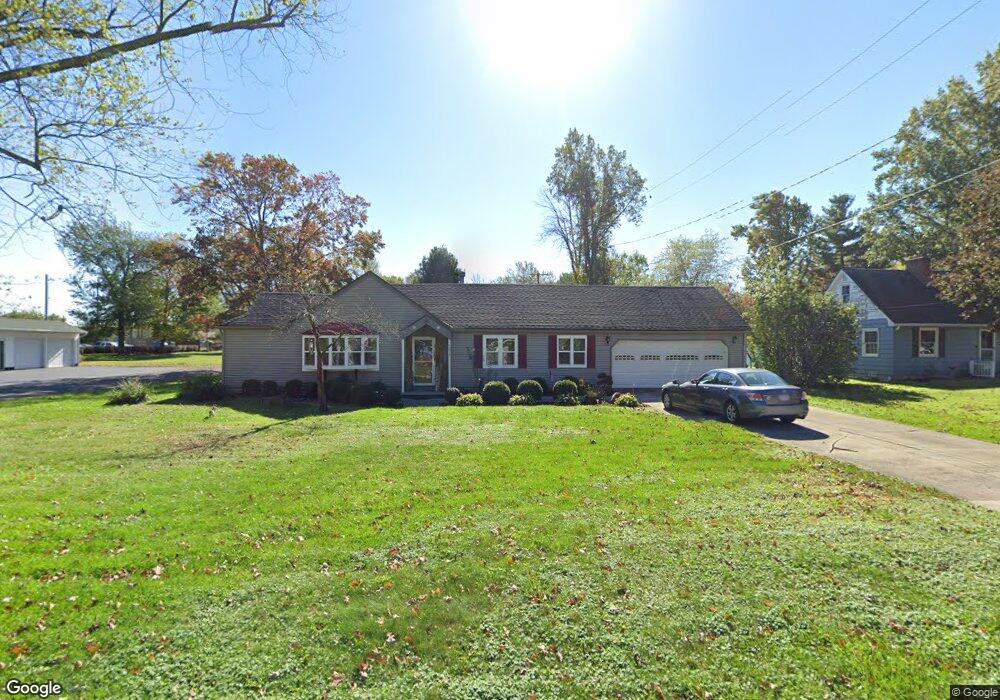
7278 Lake Rd Madison, OH 44057
Estimated Value: $180,000 - $222,450
5
Beds
2
Baths
1,662
Sq Ft
$124/Sq Ft
Est. Value
About This Home
This home is located at 7278 Lake Rd, Madison, OH 44057 and is currently estimated at $205,363, approximately $123 per square foot. 7278 Lake Rd is a home located in Lake County with nearby schools including North Elementary School, Madison Middle School, and Madison High School.
Ownership History
Date
Name
Owned For
Owner Type
Purchase Details
Closed on
Feb 22, 2013
Sold by
Bolyard John A and Bolyard Judy A
Bought by
Reed Jonna A
Current Estimated Value
Purchase Details
Closed on
Feb 13, 2009
Sold by
Miller Jonathan D
Bought by
Bolyard John A and Bolyard Judy A
Purchase Details
Closed on
Aug 19, 2005
Sold by
Fifth Third Mortgage Co
Bought by
Tcif Reo1 Llc
Purchase Details
Closed on
Aug 18, 2005
Sold by
Tcif Reo1 Llc
Bought by
Miller Jonathan D
Purchase Details
Closed on
Jun 10, 2005
Sold by
Brown Michael G
Bought by
Old Kent Mortgage Co
Purchase Details
Closed on
Mar 1, 1996
Sold by
Berkey Reynold A
Bought by
Brown Michael G and Brown Tonja S
Home Financials for this Owner
Home Financials are based on the most recent Mortgage that was taken out on this home.
Original Mortgage
$12,600
Interest Rate
9%
Mortgage Type
New Conventional
Create a Home Valuation Report for This Property
The Home Valuation Report is an in-depth analysis detailing your home's value as well as a comparison with similar homes in the area
Home Values in the Area
Average Home Value in this Area
Purchase History
| Date | Buyer | Sale Price | Title Company |
|---|---|---|---|
| Reed Jonna A | -- | None Available | |
| Bolyard John A | $62,500 | Enterprise Title | |
| Tcif Reo1 Llc | $84,000 | -- | |
| Miller Jonathan D | $86,700 | Sovereign Title Agency Llc | |
| Old Kent Mortgage Co | $84,000 | Sovereign Title Agency Llc | |
| Brown Michael G | $65,000 | -- |
Source: Public Records
Mortgage History
| Date | Status | Borrower | Loan Amount |
|---|---|---|---|
| Previous Owner | Brown Michael G | $12,600 |
Source: Public Records
Tax History Compared to Growth
Tax History
| Year | Tax Paid | Tax Assessment Tax Assessment Total Assessment is a certain percentage of the fair market value that is determined by local assessors to be the total taxable value of land and additions on the property. | Land | Improvement |
|---|---|---|---|---|
| 2024 | -- | $72,450 | $28,220 | $44,230 |
| 2023 | $5,732 | $51,570 | $18,160 | $33,410 |
| 2022 | $3,329 | $51,570 | $18,160 | $33,410 |
| 2021 | $3,322 | $53,270 | $19,860 | $33,410 |
| 2020 | $3,197 | $45,150 | $16,830 | $28,320 |
| 2019 | $3,199 | $45,150 | $16,830 | $28,320 |
| 2018 | $2,936 | $39,300 | $15,150 | $24,150 |
| 2017 | $2,779 | $39,300 | $15,150 | $24,150 |
| 2016 | $2,523 | $39,300 | $15,150 | $24,150 |
| 2015 | $2,352 | $39,300 | $15,150 | $24,150 |
| 2014 | $2,409 | $39,300 | $15,150 | $24,150 |
| 2013 | $2,732 | $39,030 | $13,090 | $25,940 |
Source: Public Records
Map
Nearby Homes
- 1180 Hearn Dr
- 7084 Lake Rd E
- 1337 Erieview Dr
- 1478 Bennett Rd
- 1338 Ormond Ave
- V/L 10 Norton Dr
- 20 Eddie Rd
- V/L 20 Norton Dr
- V/L 11 Norton Dr
- V/L 21 Norton Dr
- 1073 Ashview Dr
- 1180 N County Line Rd
- 6728 Bayside Dr Unit 21
- 1548 Rosena Ave
- V/L Magnolia #11 Dr
- 0 Indianola
- V/L Magnolia #23 Dr
- V/L Magnolia #21 Dr
- V/L Magnolia #20 Dr
- V/L Magnolia #19 Dr