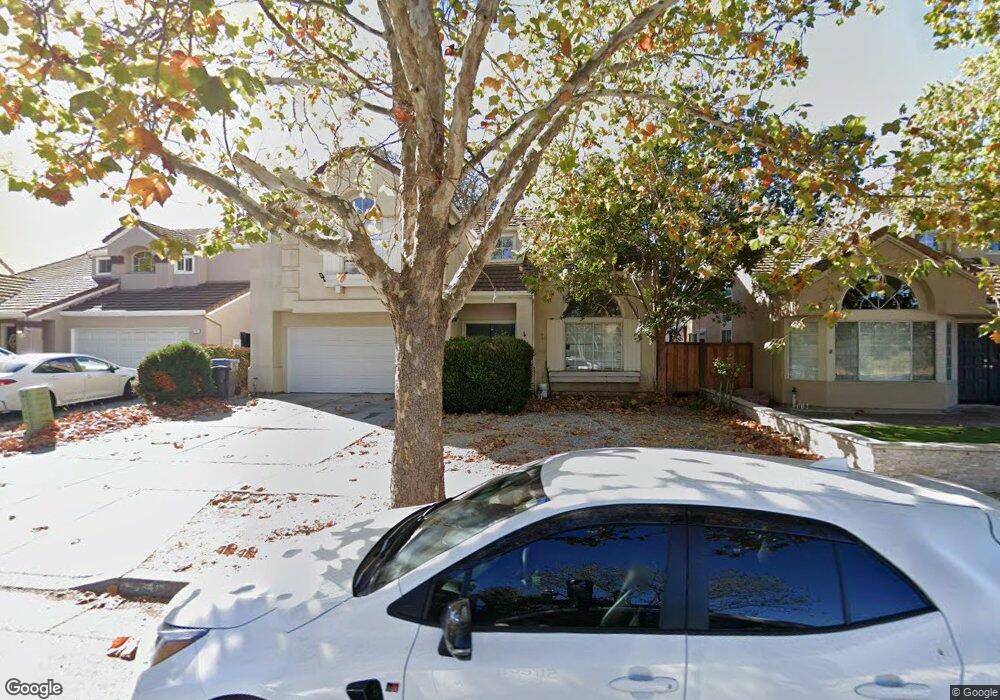
7279 Forsum Rd San Jose, CA 95138
Los Paseos NeighborhoodEstimated Value: $1,379,298 - $1,722,000
4
Beds
3
Baths
1,693
Sq Ft
$921/Sq Ft
Est. Value
About This Home
This home is located at 7279 Forsum Rd, San Jose, CA 95138 and is currently estimated at $1,560,075, approximately $921 per square foot. 7279 Forsum Rd is a home located in Santa Clara County with nearby schools including Los Paseos Elementary School, Martin Murphy Middle School, and Ann Sobrato High School.
Ownership History
Date
Name
Owned For
Owner Type
Purchase Details
Closed on
Jun 15, 2021
Sold by
Ngo Hue Thi
Bought by
Nga Nguyen
Current Estimated Value
Purchase Details
Closed on
Feb 15, 2002
Sold by
Kuzinich Michael and Stark Kuzinich Traci
Bought by
Nog Huy X
Home Financials for this Owner
Home Financials are based on the most recent Mortgage that was taken out on this home.
Original Mortgage
$420,000
Interest Rate
7.04%
Purchase Details
Closed on
Feb 14, 2002
Sold by
Nguyen Nga
Bought by
Ngo Huy X
Home Financials for this Owner
Home Financials are based on the most recent Mortgage that was taken out on this home.
Original Mortgage
$420,000
Interest Rate
7.04%
Purchase Details
Closed on
May 27, 1997
Sold by
Ut Nguyen and Thuy Tran
Bought by
Kuzinich Michael and Stark Kuzinich Traci
Home Financials for this Owner
Home Financials are based on the most recent Mortgage that was taken out on this home.
Original Mortgage
$214,600
Interest Rate
8.13%
Create a Home Valuation Report for This Property
The Home Valuation Report is an in-depth analysis detailing your home's value as well as a comparison with similar homes in the area
Home Values in the Area
Average Home Value in this Area
Purchase History
| Date | Buyer | Sale Price | Title Company |
|---|---|---|---|
| Nga Nguyen | -- | None Listed On Document | |
| Nog Huy X | $525,000 | North American Title Co | |
| Ngo Huy X | -- | North American Title Co | |
| Kuzinich Michael | $290,000 | First American Title Guarant |
Source: Public Records
Mortgage History
| Date | Status | Borrower | Loan Amount |
|---|---|---|---|
| Previous Owner | Nog Huy X | $420,000 | |
| Previous Owner | Kuzinich Michael | $214,600 | |
| Closed | Kuzinich Michael | $46,355 | |
| Closed | Nog Huy X | $52,500 |
Source: Public Records
Tax History Compared to Growth
Tax History
| Year | Tax Paid | Tax Assessment Tax Assessment Total Assessment is a certain percentage of the fair market value that is determined by local assessors to be the total taxable value of land and additions on the property. | Land | Improvement |
|---|---|---|---|---|
| 2025 | $11,169 | $775,193 | $177,264 | $597,929 |
| 2024 | $11,169 | $759,994 | $173,789 | $586,205 |
| 2023 | $10,969 | $745,093 | $170,382 | $574,711 |
| 2022 | $10,804 | $730,485 | $167,042 | $563,443 |
| 2021 | $10,491 | $716,163 | $163,767 | $552,396 |
| 2020 | $10,168 | $708,820 | $162,088 | $546,732 |
| 2019 | $10,356 | $694,922 | $158,910 | $536,012 |
| 2018 | $10,288 | $681,297 | $155,795 | $525,502 |
| 2017 | $10,177 | $667,940 | $152,741 | $515,199 |
| 2016 | $9,606 | $654,845 | $149,747 | $505,098 |
| 2015 | $9,493 | $645,009 | $147,498 | $497,511 |
| 2014 | $9,220 | $632,375 | $144,609 | $487,766 |
Source: Public Records
Map
Nearby Homes
- 6986 Gregorich Dr Unit C
- 6978 Gregorich Dr Unit F
- 7102 Avenida Rotella
- 6130 Monterey Rd Unit 201
- 6130 Monterey Rd Unit 289
- 6130 Monterey Rd Unit 9
- 6130 Monterey Rd Unit 159
- 6130 Monterey Rd Unit 260
- 6130 Monterey Rd Unit 316
- 82 Essendon Way
- 45 Cheltenham Way
- 7237 Longhill Way
- 1083 Esparanza Way
- 1075 Esparanza Way
- 1018 Niguel Ln
- 1021 Chagall Way
- 7392 Tulare Hill Dr
- 828 Monarch Ln
- 133 Cheltenham Way
- 7270 Alder Spring Way
- 7281 Forsum Rd
- 7277 Forsum Rd
- 7282 Urshan Way
- 7283 Forsum Rd
- 7284 Urshan Way
- 7275 Forsum Rd
- 7280 Urshan Way
- 7286 Urshan Way
- 7278 Urshan Way
- 7285 Forsum Rd
- 7288 Urshan Way
- 7287 Forsum Rd
- 145 Urshan Ct
- 7290 Urshan Way
- 144 Urshan Ct
- 7289 Forsum Rd
- 156 Menard Dr
- 143 Urshan Ct
- 7000 Gregorich Dr Unit G
- 7000 Gregorich Dr Unit H