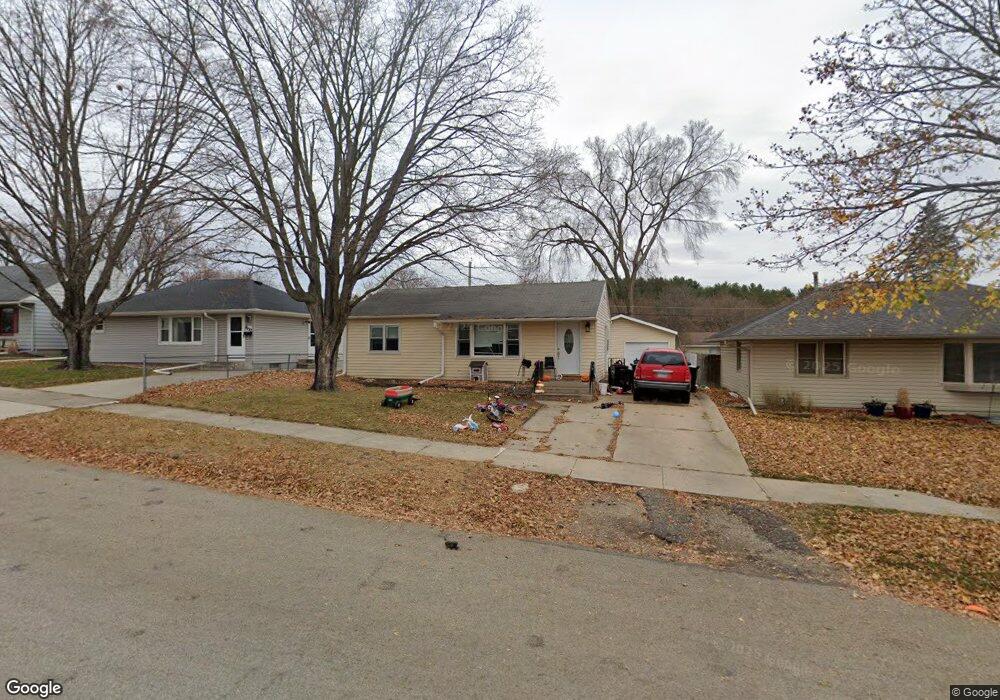
728 17th Ave NE Rochester, MN 55906
Quarry Hill West NeighborhoodEstimated Value: $248,895 - $281,000
3
Beds
1
Bath
1,776
Sq Ft
$146/Sq Ft
Est. Value
About This Home
This home is located at 728 17th Ave NE, Rochester, MN 55906 and is currently estimated at $259,474, approximately $146 per square foot. 728 17th Ave NE is a home located in Olmsted County with nearby schools including Jefferson Elementary School, Kellogg Middle School, and Century Senior High School.
Ownership History
Date
Name
Owned For
Owner Type
Purchase Details
Closed on
Aug 30, 2019
Sold by
Shidler Todd A and Shidler Pamela
Bought by
Simone Alexander R and Simone Arnicha E
Current Estimated Value
Home Financials for this Owner
Home Financials are based on the most recent Mortgage that was taken out on this home.
Original Mortgage
$174,775
Interest Rate
3.7%
Mortgage Type
FHA
Purchase Details
Closed on
Aug 28, 2019
Sold by
Shidler Karl A and Shidler Betty J
Bought by
Shidler Todd A and Shidler Pamela
Home Financials for this Owner
Home Financials are based on the most recent Mortgage that was taken out on this home.
Original Mortgage
$174,775
Interest Rate
3.7%
Mortgage Type
FHA
Purchase Details
Closed on
Mar 23, 2018
Sold by
Shidler Todd A and Shidler Pamela
Bought by
Shidler Todd A and Shidler Pamela
Purchase Details
Closed on
Oct 30, 2015
Sold by
Shidler Sharon B
Bought by
Shidler Todd A
Create a Home Valuation Report for This Property
The Home Valuation Report is an in-depth analysis detailing your home's value as well as a comparison with similar homes in the area
Home Values in the Area
Average Home Value in this Area
Purchase History
| Date | Buyer | Sale Price | Title Company |
|---|---|---|---|
| Simone Alexander R | $178,000 | Rochester Title & Escrow Co | |
| Shidler Todd A | $70,000 | Rochester Title & Escrow Co | |
| Shidler Todd A | -- | None Available | |
| Shidler Todd A | -- | Attorney |
Source: Public Records
Mortgage History
| Date | Status | Borrower | Loan Amount |
|---|---|---|---|
| Previous Owner | Simone Alexander R | $174,775 |
Source: Public Records
Tax History Compared to Growth
Tax History
| Year | Tax Paid | Tax Assessment Tax Assessment Total Assessment is a certain percentage of the fair market value that is determined by local assessors to be the total taxable value of land and additions on the property. | Land | Improvement |
|---|---|---|---|---|
| 2024 | $2,610 | $208,300 | $45,000 | $163,300 |
| 2023 | $2,368 | $203,200 | $45,000 | $158,200 |
| 2022 | $2,272 | $195,700 | $45,000 | $150,700 |
| 2021 | $1,902 | $183,000 | $35,000 | $148,000 |
| 2020 | $1,552 | $157,700 | $20,000 | $137,700 |
| 2019 | $1,390 | $129,900 | $20,000 | $109,900 |
| 2018 | $1,194 | $119,700 | $20,000 | $99,700 |
| 2017 | $1,204 | $105,700 | $20,000 | $85,700 |
| 2016 | $1,168 | $78,000 | $12,400 | $65,600 |
| 2015 | $1,082 | $74,300 | $12,200 | $62,100 |
| 2014 | $1,052 | $74,300 | $12,200 | $62,100 |
| 2012 | -- | $73,800 | $12,167 | $61,633 |
Source: Public Records
Map
Nearby Homes
- 800 16th Ave NE
- 808 13th Ave NE
- 317 15th Ave NE
- 302 17th Ave NE
- 1227 19th Ave NE
- 1251 19th Ave NE
- 1309 3rd St NE
- 1500 Viola Rd NE
- 1206 3rd St NE
- 401 9th Ave NE
- 915 E Center St
- 1646 2nd St SE
- 815 E Center St
- 126 11th Ave SE
- 1703 20th Ave NE
- 318 13th Ave SE
- 125 10th Ave SE
- 12 6th Ave SE
- 412 12th Ave SE
- 1097 Century Village Ln NE
- 800 17th Ave NE
- 724 17th Ave NE
- 729 18th Ave NE
- 804 17th Ave NE
- 720 17th Ave NE
- 801 18th Ave NE
- 725 18th Ave NE
- 721 721 17th-Avenue-ne
- 721 18th Ave NE
- 721 721 18th-Avenue-ne
- 808 17th Ave NE
- 716 17th Ave NE
- 729 729 17th-Avenue-ne
- 729 17th Ave NE
- 717 717 17th-Avenue-ne
- 725 17th Ave NE
- 801 17th Ave NE
- 809 809 18th-Avenue-ne
- 809 18th Ave NE
- 717 18th Ave NE