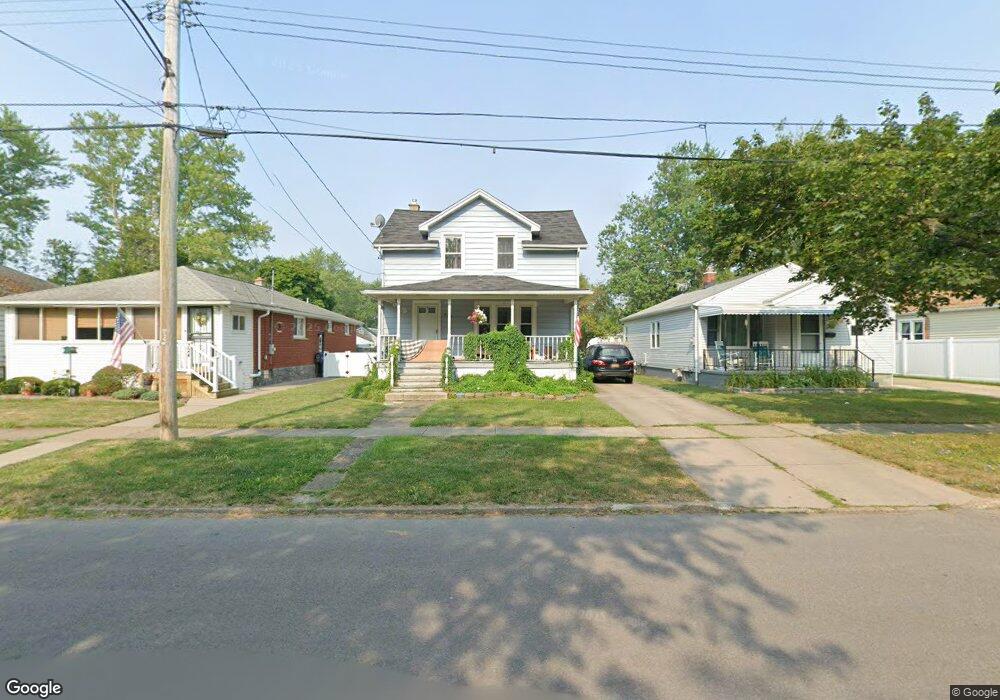
728 93rd St Niagara Falls, NY 14304
LaSalle NeighborhoodEstimated Value: $166,000 - $202,475
3
Beds
1
Bath
1,152
Sq Ft
$159/Sq Ft
Est. Value
About This Home
This home is located at 728 93rd St, Niagara Falls, NY 14304 and is currently estimated at $182,869, approximately $158 per square foot. 728 93rd St is a home located in Niagara County with nearby schools including Niagara Falls High School, Christ the King Preparatory Academy, and Catholic Academy Of Niagara Falls - Elementary.
Ownership History
Date
Name
Owned For
Owner Type
Purchase Details
Closed on
Jul 18, 2007
Sold by
Faithe Renaud
Bought by
Previte Christopher
Current Estimated Value
Home Financials for this Owner
Home Financials are based on the most recent Mortgage that was taken out on this home.
Original Mortgage
$77,168
Outstanding Balance
$49,447
Interest Rate
6.54%
Mortgage Type
FHA
Estimated Equity
$133,422
Purchase Details
Closed on
May 6, 2005
Sold by
Proulx Kevin M
Bought by
Renaud Faithe
Home Financials for this Owner
Home Financials are based on the most recent Mortgage that was taken out on this home.
Original Mortgage
$69,900
Interest Rate
6.01%
Mortgage Type
Adjustable Rate Mortgage/ARM
Purchase Details
Closed on
Dec 29, 1994
Sold by
Love Canal Area
Bought by
Proulx Kevin M and Proulx Dannette
Create a Home Valuation Report for This Property
The Home Valuation Report is an in-depth analysis detailing your home's value as well as a comparison with similar homes in the area
Home Values in the Area
Average Home Value in this Area
Purchase History
| Date | Buyer | Sale Price | Title Company |
|---|---|---|---|
| Previte Christopher | $80,030 | Harris Beach | |
| Renaud Faithe | $69,900 | John Trigilio | |
| Proulx Kevin M | $46,000 | -- |
Source: Public Records
Mortgage History
| Date | Status | Borrower | Loan Amount |
|---|---|---|---|
| Open | Previte Christopher J | $5,769 | |
| Closed | Previte Christopher J | $7,531 | |
| Closed | Previte Christopher J | $6,747 | |
| Open | Previte Christopher | $77,168 | |
| Previous Owner | Renaud Faithe | $69,900 |
Source: Public Records
Tax History Compared to Growth
Tax History
| Year | Tax Paid | Tax Assessment Tax Assessment Total Assessment is a certain percentage of the fair market value that is determined by local assessors to be the total taxable value of land and additions on the property. | Land | Improvement |
|---|---|---|---|---|
| 2024 | $3,297 | $63,000 | $2,600 | $60,400 |
| 2023 | $3,297 | $63,000 | $2,600 | $60,400 |
| 2022 | $1,843 | $63,000 | $2,600 | $60,400 |
| 2021 | $1,842 | $63,000 | $2,600 | $60,400 |
| 2020 | $1,223 | $63,000 | $2,600 | $60,400 |
| 2019 | $1,174 | $63,000 | $2,600 | $60,400 |
| 2018 | $1,810 | $63,000 | $2,600 | $60,400 |
| 2017 | $1,174 | $63,000 | $2,600 | $60,400 |
| 2016 | $1,760 | $63,000 | $2,600 | $60,400 |
| 2015 | -- | $63,000 | $2,600 | $60,400 |
| 2014 | -- | $63,000 | $2,600 | $60,400 |
Source: Public Records
Map
Nearby Homes