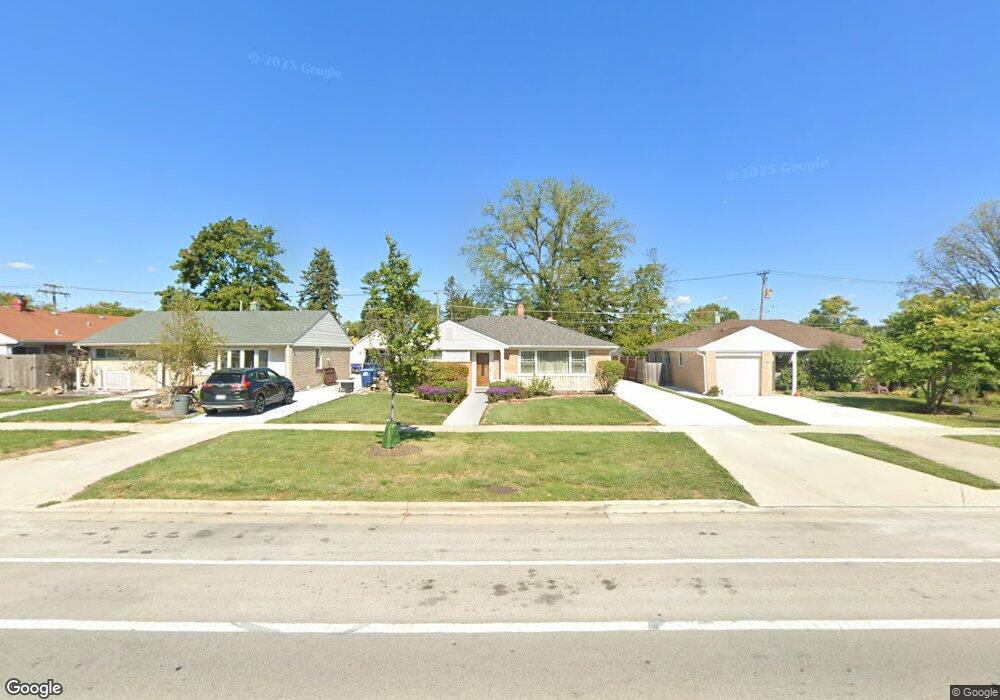
728 E Algonquin Rd Des Plaines, IL 60016
Estimated Value: $333,000 - $367,782
3
Beds
2
Baths
1,579
Sq Ft
$222/Sq Ft
Est. Value
About This Home
This home is located at 728 E Algonquin Rd, Des Plaines, IL 60016 and is currently estimated at $350,446, approximately $221 per square foot. 728 E Algonquin Rd is a home located in Cook County with nearby schools including Forest Elementary School, Algonquin Middle School, and Maine West High School.
Ownership History
Date
Name
Owned For
Owner Type
Purchase Details
Closed on
Mar 5, 2011
Sold by
U S Bank National Association
Bought by
Ahmed Awais S
Current Estimated Value
Home Financials for this Owner
Home Financials are based on the most recent Mortgage that was taken out on this home.
Original Mortgage
$99,600
Interest Rate
4.86%
Mortgage Type
New Conventional
Purchase Details
Closed on
Jul 22, 2010
Sold by
Cruz Terri and Cruz Terri
Bought by
Us Bank National Association
Purchase Details
Closed on
Jan 26, 2006
Sold by
Smuk Steve
Bought by
Cruz Terrie
Home Financials for this Owner
Home Financials are based on the most recent Mortgage that was taken out on this home.
Original Mortgage
$247,500
Interest Rate
8.75%
Mortgage Type
Unknown
Create a Home Valuation Report for This Property
The Home Valuation Report is an in-depth analysis detailing your home's value as well as a comparison with similar homes in the area
Home Values in the Area
Average Home Value in this Area
Purchase History
| Date | Buyer | Sale Price | Title Company |
|---|---|---|---|
| Ahmed Awais S | $124,500 | First American Title | |
| Us Bank National Association | -- | None Available | |
| Cruz Terrie | $275,000 | Atgf Inc |
Source: Public Records
Mortgage History
| Date | Status | Borrower | Loan Amount |
|---|---|---|---|
| Previous Owner | Ahmed Awais S | $99,600 | |
| Previous Owner | Cruz Terrie | $247,500 |
Source: Public Records
Tax History
| Year | Tax Paid | Tax Assessment Tax Assessment Total Assessment is a certain percentage of the fair market value that is determined by local assessors to be the total taxable value of land and additions on the property. | Land | Improvement |
|---|---|---|---|---|
| 2025 | $6,221 | $35,000 | $6,201 | $28,799 |
| 2024 | $6,221 | $26,911 | $5,168 | $21,743 |
| 2023 | $6,582 | $26,911 | $5,168 | $21,743 |
| 2022 | $6,582 | $29,001 | $5,168 | $23,833 |
| 2021 | $6,474 | $24,391 | $4,306 | $20,085 |
| 2020 | $6,433 | $24,391 | $4,306 | $20,085 |
| 2019 | $7,267 | $30,431 | $4,306 | $26,125 |
| 2018 | $5,768 | $22,721 | $3,789 | $18,932 |
| 2017 | $5,683 | $22,721 | $3,789 | $18,932 |
| 2016 | $5,620 | $22,721 | $3,789 | $18,932 |
| 2015 | $4,802 | $18,509 | $3,272 | $15,237 |
| 2014 | $4,717 | $18,509 | $3,272 | $15,237 |
| 2013 | $5,075 | $20,215 | $3,272 | $16,943 |
Source: Public Records
Map
Nearby Homes
- 1162 W Grant Dr
- 674 E Algonquin Rd
- 1205 S Wolf Rd
- 1122 Alfini Dr
- 1394 Carol Ln
- 505 Forest Ave
- 881 E Thacker St
- 664 E Oakton St
- 886 E Thacker St
- 434 E Thacker St
- 1596 Oxford Rd
- 508 Crestwood Dr
- 584 S 4th Ave
- 799 Graceland Ave Unit 504A
- 799 Graceland Ave Unit 404A
- 1005 Woodlawn Ave
- 1673 Spruce Ave
- 1426 Danbury Ln
- 887 Ingram Place
- 905 Center St Unit B208
- 736 E Algonquin Rd
- 722 E Algonquin Rd
- 1165 Southwest Place
- 742 E Algonquin Rd
- 710 E Algonquin Rd
- 752 E Algonquin Rd
- 1159 Southwest Place
- 1154 W Grant Dr
- 1156 W Grant Dr
- 758 E Algonquin Rd
- 1148 W Grant Dr
- 1160 W Grant Dr
- 692 E Algonquin Rd
- 1142 W Grant Dr
- 766 E Algonquin Rd
- 693 Walnut Ct
- 682 E Algonquin Rd
- 774 E Algonquin Rd
- 1164 W Grant Dr
- 685 Walnut Ct