Estimated Value: $5,803,000
5
Beds
11
Baths
6,064
Sq Ft
$957/Sq Ft
Est. Value
About This Home
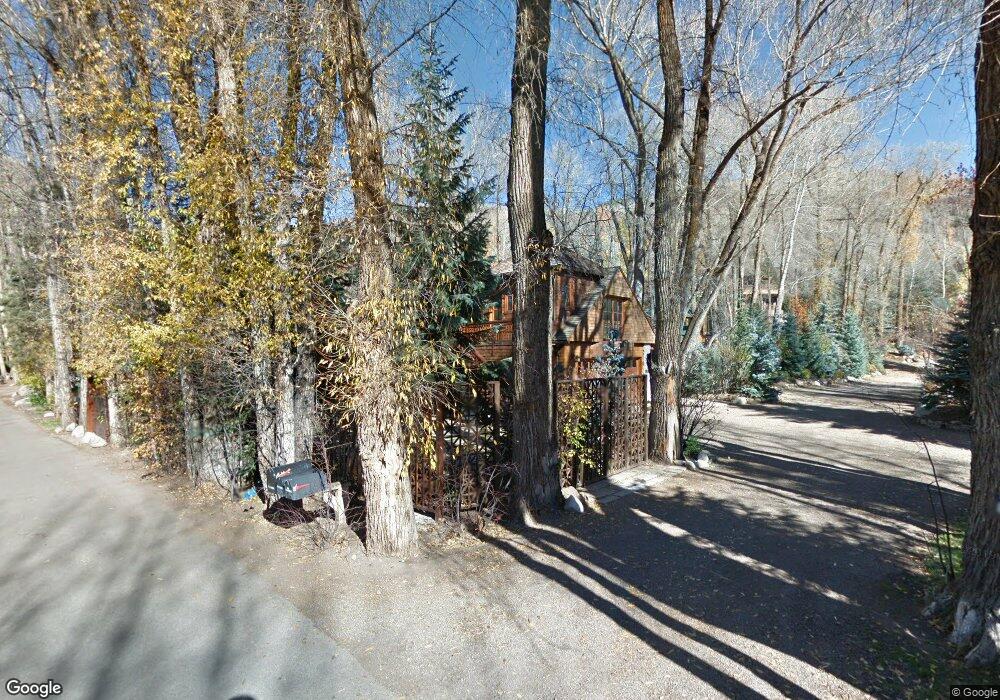
This home is located at 728 E Francis St Unit 470 N Spring Street, Aspen, CO 81611 and is currently estimated at $5,803,000, approximately $956 per square foot. 728 E Francis St Unit 470 N Spring Street is a home located in Pitkin County with nearby schools including Aspen Elementary School, Aspen Middle School, and Aspen High School.
Ownership History
Date
Name
Owned For
Owner Type
Purchase Details
Closed on
Aug 22, 2019
Sold by
B & Z 2010 Revocable Trust
Bought by
B & Z 2010 Revocable Trust and Z&B 2010 Revocable Trust
Current Estimated Value
Purchase Details
Closed on
Jan 17, 2012
Sold by
Peepers Hollow Llc
Bought by
B & Z 2010 Revocable Trust and Z & B 2010 Revocable Trust
Purchase Details
Closed on
Mar 26, 2009
Sold by
Peyton E Budinger Revocable Trust
Bought by
Budinger William D
Create a Home Valuation Report for This Property
The Home Valuation Report is an in-depth analysis detailing your home's value as well as a comparison with similar homes in the area
Home Values in the Area
Average Home Value in this Area
Purchase History
| Date | Buyer | Sale Price | Title Company |
|---|---|---|---|
| B & Z 2010 Revocable Trust | -- | None Available | |
| B & Z 2010 Revocable Trust | -- | None Available | |
| Budinger William D | -- | None Available |
Source: Public Records
Tax History Compared to Growth
Tax History
| Year | Tax Paid | Tax Assessment Tax Assessment Total Assessment is a certain percentage of the fair market value that is determined by local assessors to be the total taxable value of land and additions on the property. | Land | Improvement |
|---|---|---|---|---|
| 2024 | $46,591 | $1,417,220 | $394,270 | $1,022,950 |
| 2023 | $46,591 | $1,433,680 | $398,850 | $1,034,830 |
| 2022 | $32,131 | $876,400 | $326,650 | $549,750 |
| 2021 | $31,992 | $901,620 | $336,050 | $565,570 |
| 2020 | $26,103 | $730,620 | $264,550 | $466,070 |
| 2019 | $26,103 | $730,620 | $264,550 | $466,070 |
| 2018 | $21,466 | $735,730 | $266,400 | $469,330 |
| 2017 | $18,940 | $595,500 | $252,000 | $343,500 |
| 2016 | $16,808 | $517,610 | $278,600 | $239,010 |
| 2015 | $16,591 | $517,610 | $278,600 | $239,010 |
| 2014 | $15,012 | $447,560 | $302,480 | $145,080 |
Source: Public Records
Map
Nearby Homes
- 950 Vine St Unit 950
- 306 Oak Ln
- 566 Race St
- 501 Rio Grande Place Unit 204
- 117 Neale Ave
- 534 Spruce St
- 536 Spruce St
- 155 Lone Pine Rd Unit 2
- 140 Maple Ln Unit 140
- 0 Pitkin County Tdr Unit 185846
- 725 E Main St Unit 205
- 416 Vine St Unit 416
- City Tdr
- 332 Vine St Unit 332
- 800 E Hopkins Ave Unit A1
- 800 E Hopkins Ave Unit A3
- 979 Queen St
- 415 Park Cir Unit 5
- 250 S Original St Unit B
- 515 Park Cir
- 728 E Francis St
- 728 E Francis St Unit & 470 N Spring Stree
- 470 N Spring St
- 735 E Francis St
- 707 Gibson Ave
- 717 W Francis St Unit A
- 390 N Spring St
- 445 N Spring St
- 701 Gibson Ave Unit 2
- 433 & 445 N Spring St
- 730 Bay St
- 720 Bay St
- 375 N Spring St
- 505 Walnut St
- 801 South Ave Unit Umit B
- 801 South Ave Unit B
- 801 South Ave
- 801 South Ave Unit A
- 523 Walnut St
- 655 Gibson Ave Unit A