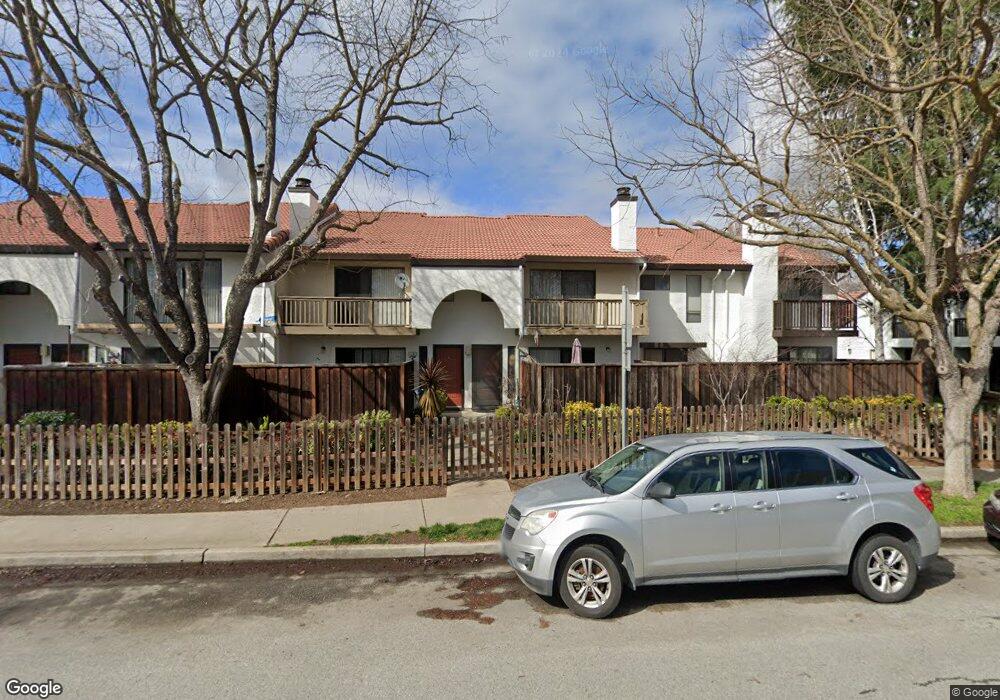
728 Gettysburg Way Gilroy, CA 95020
Estimated Value: $591,000 - $687,000
2
Beds
3
Baths
1,645
Sq Ft
$402/Sq Ft
Est. Value
About This Home
This home is located at 728 Gettysburg Way, Gilroy, CA 95020 and is currently estimated at $661,492, approximately $402 per square foot. 728 Gettysburg Way is a home located in Santa Clara County with nearby schools including Glen View Elementary School, Solorsano Middle School, and Gilroy High School.
Ownership History
Date
Name
Owned For
Owner Type
Purchase Details
Closed on
Nov 1, 2009
Sold by
Cagina Kathy
Bought by
Sanchez Adam and Sanchez Natalie
Current Estimated Value
Purchase Details
Closed on
Jan 9, 2007
Sold by
Muzzicato Anthony J and Muzzicato Jeanne E
Bought by
Sanchez Emily M
Home Financials for this Owner
Home Financials are based on the most recent Mortgage that was taken out on this home.
Original Mortgage
$12,000
Interest Rate
6.1%
Mortgage Type
New Conventional
Purchase Details
Closed on
Jun 13, 2005
Sold by
Muzzicato Anthony J and Muzzicato Jeanne
Bought by
Muzzicato Anthony J and Muzzicato Jeanne E
Create a Home Valuation Report for This Property
The Home Valuation Report is an in-depth analysis detailing your home's value as well as a comparison with similar homes in the area
Home Values in the Area
Average Home Value in this Area
Purchase History
| Date | Buyer | Sale Price | Title Company |
|---|---|---|---|
| Sanchez Adam | $227,000 | None Available | |
| Cagina Kathy | $9,500 | None Available | |
| Sanchez Emily M | $475,000 | Old Republic Title Company | |
| Caginia Kathy | -- | Old Republic Title Company | |
| Sanchez Mark | -- | Old Republic Title Company | |
| Sanchez Adam | -- | Old Republic Title Company | |
| Muzzicato Anthony J | -- | -- |
Source: Public Records
Mortgage History
| Date | Status | Borrower | Loan Amount |
|---|---|---|---|
| Previous Owner | Sanchez Adam | $12,000 |
Source: Public Records
Tax History Compared to Growth
Tax History
| Year | Tax Paid | Tax Assessment Tax Assessment Total Assessment is a certain percentage of the fair market value that is determined by local assessors to be the total taxable value of land and additions on the property. | Land | Improvement |
|---|---|---|---|---|
| 2025 | $3,965 | $322,691 | $129,073 | $193,618 |
| 2024 | $3,965 | $316,365 | $126,543 | $189,822 |
| 2023 | $3,942 | $310,162 | $124,062 | $186,100 |
| 2022 | $3,878 | $304,081 | $121,630 | $182,451 |
| 2021 | $3,861 | $298,120 | $119,246 | $178,874 |
| 2020 | $3,819 | $295,064 | $118,024 | $177,040 |
| 2019 | $3,784 | $289,279 | $115,710 | $173,569 |
| 2018 | $3,535 | $283,608 | $113,442 | $170,166 |
| 2017 | $3,610 | $278,048 | $111,218 | $166,830 |
| 2016 | $3,532 | $272,597 | $109,038 | $163,559 |
| 2015 | $3,333 | $268,504 | $107,401 | $161,103 |
| 2014 | $3,313 | $263,246 | $105,298 | $157,948 |
Source: Public Records
Map
Nearby Homes
- 773 Gettysburg Way
- 738 Gettysburg Way
- 771 Williamsburg Way Unit C
- 775 Williamsburg Way Unit B
- 895 Greenwich Dr
- 7035 Yorktown Dr
- 7245 Trenton Place
- 500 W 10th St Unit 10
- 500 W 10th St Unit 29
- 500 W 10th St Unit 61
- 500 W 10th St Unit 73
- 7210 Yorktown Dr
- 7343 Princevalle St Unit Homesite 19
- Plan 2 at Heritage on 6th Street
- Plan 1 at Heritage on 6th Street
- 7352 Ailes Ct Unit Homesite 7
- 7351 Princevalle St Unit Homesite 18
- 7363 Ailes Ct Unit Homesite 5
- 7360 Ailes Ct Unit Homesite 8
- 7310 Carmel St
- 724 Gettysburg Way
- 732 Gettysburg Way
- 734 Gettysburg Way
- 722 Gettysburg Way
- 753 Gettysburg Way
- 749 Gettysburg Way
- 729 Gettysburg Way
- 718 Gettysburg Way Unit C
- 718 Gettysburg Way Unit B
- 718 Gettysburg Way Unit A
- 718 Gettysburg Way Unit D
- 745 Gettysburg Way
- 733 Gettysburg Way
- 742 Gettysburg Way
- 743 Gettysburg Way
- 735 Gettysburg Way
- 744 Gettysburg Way
- 739 Gettysburg Way
- 725 Gettysburg Way
- 755 Gettysburg Way