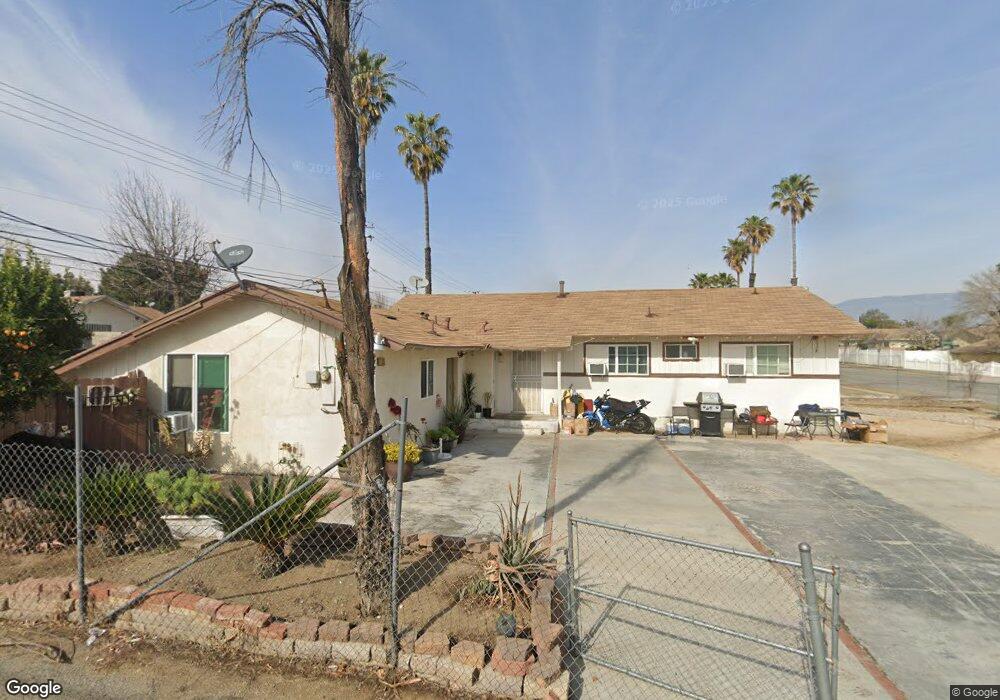
728 N Rosalind Ave Rialto, CA 92376
Terrace NeighborhoodEstimated Value: $434,000 - $563,000
4
Beds
2
Baths
1,544
Sq Ft
$335/Sq Ft
Est. Value
About This Home
This home is located at 728 N Rosalind Ave, Rialto, CA 92376 and is currently estimated at $517,717, approximately $335 per square foot. 728 N Rosalind Ave is a home located in San Bernardino County with nearby schools including Myers Elementary School, Frisbie Middle School, and Eisenhower High School.
Ownership History
Date
Name
Owned For
Owner Type
Purchase Details
Closed on
Mar 18, 2024
Sold by
Herrera Abelardo and Herrera Patricia
Bought by
Ap Herrera Investors Llc
Current Estimated Value
Home Financials for this Owner
Home Financials are based on the most recent Mortgage that was taken out on this home.
Original Mortgage
$337,800
Outstanding Balance
$332,192
Interest Rate
6.64%
Mortgage Type
New Conventional
Estimated Equity
$185,525
Purchase Details
Closed on
Nov 18, 2002
Sold by
Hoe Investments Inc
Bought by
Herrera Abelardo and Herrera Patricia
Home Financials for this Owner
Home Financials are based on the most recent Mortgage that was taken out on this home.
Original Mortgage
$137,738
Interest Rate
6.28%
Mortgage Type
FHA
Purchase Details
Closed on
Jun 17, 2002
Sold by
Diaz Juan E and Diaz Ascencion P
Bought by
H O E Investments
Purchase Details
Closed on
Mar 7, 2002
Sold by
Montoya Juan S
Bought by
Diaz Juan E and Diaz Ascension P
Purchase Details
Closed on
Jul 22, 1997
Sold by
Juan S Diaz Juan E P
Bought by
Diaz Juan E and Diaz Ascencion P
Create a Home Valuation Report for This Property
The Home Valuation Report is an in-depth analysis detailing your home's value as well as a comparison with similar homes in the area
Home Values in the Area
Average Home Value in this Area
Purchase History
| Date | Buyer | Sale Price | Title Company |
|---|---|---|---|
| Ap Herrera Investors Llc | -- | First American Title | |
| Herrera Abelardo | $140,000 | Southland Title Corporation | |
| H O E Investments | $101,000 | -- | |
| Diaz Juan E | -- | -- | |
| Diaz Juan E | -- | -- |
Source: Public Records
Mortgage History
| Date | Status | Borrower | Loan Amount |
|---|---|---|---|
| Open | Ap Herrera Investors Llc | $337,800 | |
| Previous Owner | Herrera Abelardo | $137,738 |
Source: Public Records
Tax History Compared to Growth
Tax History
| Year | Tax Paid | Tax Assessment Tax Assessment Total Assessment is a certain percentage of the fair market value that is determined by local assessors to be the total taxable value of land and additions on the property. | Land | Improvement |
|---|---|---|---|---|
| 2025 | $2,877 | $226,582 | $57,934 | $168,648 |
| 2024 | $2,877 | $222,139 | $56,798 | $165,341 |
| 2023 | $3,054 | $217,783 | $55,684 | $162,099 |
| 2022 | $2,841 | $213,513 | $54,592 | $158,921 |
| 2021 | $2,707 | $200,527 | $53,522 | $147,005 |
| 2020 | $2,551 | $185,407 | $52,973 | $132,434 |
| 2019 | $2,496 | $181,771 | $51,934 | $129,837 |
| 2018 | $2,427 | $178,207 | $50,916 | $127,291 |
| 2017 | $2,405 | $174,713 | $49,918 | $124,795 |
| 2016 | $2,375 | $171,287 | $48,939 | $122,348 |
| 2015 | $2,236 | $168,714 | $48,204 | $120,510 |
| 2014 | $2,102 | $165,409 | $47,260 | $118,149 |
Source: Public Records
Map
Nearby Homes
- 2837 7th St
- 665 N Pepper Ave
- 648 N Rosalind Ave
- 2678 Etiwanda Ave
- 668 N Mulberry Ave
- 565 N Meridian Ave
- 555 N Meridian Ave
- 556 N Marvin Dr
- 711 N Eucalyptus Ave
- 559 N Marvin Dr
- 2606 Maple St
- 2495 Etiwanda Ave
- 857 N Dallas Ave
- 820 San Carlo Ave
- 1044 N Mulberry Ave
- 2455 Saint Elmo Dr
- 917 E Jackson St
- 2505 W E Foothill Blvd Unit 231
- 1014 E Jackson St
- 369 N Eucalyptus Ave Unit 34
- 738 N Rosalind Ave
- 714 N Rosalind Ave
- 740 N Rosalind St
- 727 N Pepper Ave
- 737 N Pepper Ave
- 748 N Rosalind Ave
- 2849 Rue Cir
- 715 N Pepper Ave
- 704 N Rosalind Ave
- 749 N Pepper Ave
- 2848 7th St
- 705 N Pepper Ave
- 762 N Rosalind Ave
- 2848 Rue Cir
- 694 N Rosalind Ave
- 2837 Rue Cir
- 761 N Pepper Ave
- 2836 7th St
- 695 N Pepper Ave
- 2836 Rue Cir